MoneyGram 2007 Annual Report Download - page 40
Download and view the complete annual report
Please find page 40 of the 2007 MoneyGram annual report below. You can navigate through the pages in the report by either clicking on the pages listed below, or by using the keyword search tool below to find specific information within the annual report.-
 1
1 -
2
-
3
-
4
-
5
-
6
-
7
-
8
-
9
-
10
-
11
-
12
-
13
-
14
-
15
-
16
-
17
-
18
-
19
-
20
-
21
-
22
-
23
-
24
-
25
-
26
-
27
-
28
-
29
-
 30
30 -
 31
31 -
 32
32 -
 33
33 -
 34
34 -
 35
35 -
 36
36 -
 37
37 -
 38
38 -
 39
39 -
 40
40 -
 41
41 -
 42
42 -
 43
43 -
 44
44 -
 45
45 -
 46
46 -
 47
47 -
 48
48 -
 49
49 -
 50
50 -
51
-
52
-
53
-
54
-
55
-
56
-
57
-
58
-
59
-
60
-
61
-
62
-
63
-
64
-
65
-
66
-
67
-
68
-
69
-
70
-
71
-
72
-
73
-
74
-
75
-
76
-
77
-
78
-
79
-
80
-
81
-
82
-
83
-
84
-
85
-
86
-
87
-
88
-
89
-
90
-
91
-
92
-
93
-
94
-
95
-
96
-
97
-
98
-
99
-
100
-
101
-
102
-
103
-
104
-
105
-
106
-
107
-
108
-
109
-
110
-
111
-
112
-
113
-
114
-
115
-
116
-
117
-
118
-
119
-
120
-
121
-
122
-
123
-
124
-
125
-
126
-
127
-
128
-
129
-
130
-
131
-
132
-
133
-
134
-
135
-
136
-
137
-
138
-
139
-
140
-
141
-
142
-
143
-
144
-
145
-
146
-
147
-
148
-
149
-
150
-
151
-
152
-
153
-
154
-
155
-
156
-
157
-
158
-
159
-
160
-
161
-
162
-
163
-
164
 |
 |
Table of Contents
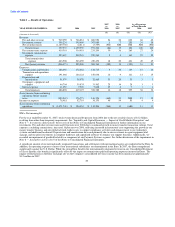
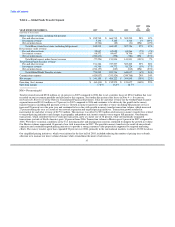
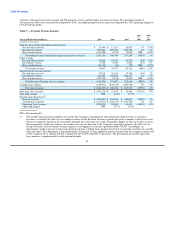
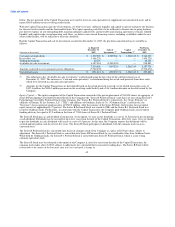
Table 6 — Global Funds Transfer Segment
2007 2006
vs. vs.
YEAR ENDED DECEMBER 31, 2007 2006 2005 2006 2005
(Amounts in thousands)
Money transfer revenue, including bill payment
Fee and other revenue $ 852,749 $ 664,712 $ 505,239 28% 32%
Investment revenue 5,194 5,165 2,518 1% 105%
Net securities losses (9,724) (25) (31) NM (19%)
Total Money transfer revenue, including bill payment 848,219 669,852 507,726 27% 32%
Retail money order revenue
Fee and other revenue 58,637 62,885 63,966 (7%) (2%)
Investment revenue 88,572 89,607 78,706 (1%) 14%
Net securities losses (224,433) (598) (781) NM (23%)
Total Retail money order (losses) revenue (77,224) 151,894 141,891 (151%) 7%
Total Global Funds Transfer revenue
Fee and other revenue 911,386 727,597 569,205 25% 28%
Investment revenue 93,766 94,772 81,224 (1%) 17%
Net securities losses (234,157) (623) (812) NM (23%)
Total Global Funds Transfer revenue 770,995 821,746 649,617 (6%) 26%
Commissions expense (429,837) (333,524) (249,768) 29% 34%
Net revenue $ 341,158 $ 488,222 $ 399,849 (30%) 22%
Operating (loss) income $ (60,410) $ 152,579 $ 121,677 (140%) 25%
Operating margin (7.8%) 18.6% 18.7%
NM = Not meaningful
Total revenue decreased $50.8 million, or six percent, in 2007 compared to 2006 due to net securities losses of $234.2 million that were
recorded on our investment portfolio and allocated to this segment. See further discussion of the losses in Note 4 — Investments
(Substantially Restricted) of the Notes to Consolidated Financial Statements. Total fee and other revenue for the Global Funds Transfer
segment increased $183.8 million, or 25 percent, in 2007 compared to 2006 and continues to be driven by the growth in the money
transfer business (including bill payment services). Growth in money transfer fee and other revenue (including bill payment services)
increased 28 percent over the prior year and continued to be in line with growth in money transfer transaction volume, which increased
27 percent during the year as a result of our network expansion and targeted pricing initiatives. Transaction growth resulted in
incremental fee and other revenue of $179.0 million. This increase was offset by $9.9 million of decreases in money transfer fees related
to targeted pricing initiatives and changes in geographic and product mix (money transfer versus urgent bill payment). Our domestic
transactions, which contribute lower revenue per transaction, grew at a faster rate of 38 percent, while internationally originated
transactions (outside of North America) grew 34 percent from 2006. Transaction volume to Mexico grew 8 percent in 2007 compared to
2006. We believe economic conditions in the U.S. housing market and immigration concerns continued to dampen the growth in volume.
Our Mexico volume represented 10 percent of our total transactions in 2007. The growth in money transfer is the result of our network
expansion and continued targeted pricing initiatives to provide a strong consumer value proposition supported by targeted marketing
efforts. The money transfer agent base expanded 30 percent over 2006, primarily in the international markets, to about 143,000 locations.
Our simplified pricing initiatives, which were initiated in the first half of 2005, included reducing the number of pricing tiers or bands,
allowing us to manage our price-volume dynamic while streamlining the point of sale process
37