MoneyGram 2007 Annual Report Download - page 122
Download and view the complete annual report
Please find page 122 of the 2007 MoneyGram annual report below. You can navigate through the pages in the report by either clicking on the pages listed below, or by using the keyword search tool below to find specific information within the annual report.-
 1
1 -
2
-
3
-
4
-
5
-
6
-
7
-
8
-
9
-
10
-
11
-
12
-
13
-
14
-
15
-
16
-
17
-
18
-
19
-
20
-
21
-
22
-
23
-
24
-
25
-
26
-
27
-
28
-
29
-
30
-
31
-
32
-
33
-
34
-
35
-
36
-
37
-
38
-
39
-
40
-
41
-
42
-
43
-
44
-
45
-
46
-
47
-
48
-
49
-
50
-
51
-
52
-
53
-
54
-
55
-
56
-
57
-
58
-
59
-
60
-
61
-
62
-
63
-
64
-
65
-
66
-
67
-
68
-
69
-
70
-
71
-
72
-
73
-
74
-
75
-
76
-
77
-
78
-
79
-
80
-
81
-
82
-
83
-
84
-
85
-
86
-
87
-
88
-
89
-
90
-
91
-
92
-
93
-
94
-
95
-
96
-
97
-
98
-
99
-
100
-
101
-
102
-
103
-
104
-
105
-
106
-
107
-
108
-
109
-
110
-
111
-
 112
112 -
 113
113 -
 114
114 -
 115
115 -
 116
116 -
 117
117 -
 118
118 -
 119
119 -
 120
120 -
 121
121 -
 122
122 -
 123
123 -
 124
124 -
 125
125 -
 126
126 -
 127
127 -
 128
128 -
 129
129 -
 130
130 -
 131
131 -
 132
132 -
133
-
134
-
135
-
136
-
137
-
138
-
139
-
140
-
141
-
142
-
143
-
144
-
145
-
146
-
147
-
148
-
149
-
150
-
151
-
152
-
153
-
154
-
155
-
156
-
157
-
158
-
159
-
160
-
161
-
162
-
163
-
164
 |
 |

Table of Contents
MONEYGRAM INTERNATIONAL, INC. AND SUBSIDIARIES
NOTES TO CONSOLIDATED FINANCIAL STATEMENTS — (Continued)
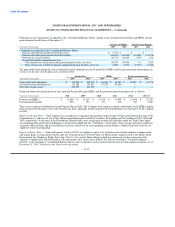
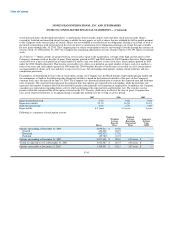
The following table reconciles segment assets to total assets reported in the financial statements as of December 31:
(Amounts in thousands) 2007 2006 2005
Assets
Global Funds Transfer $ 2,423,090 $ 3,091,519 $ 2,909,246
Payment Systems 5,497,168 6,168,134 6,252,528
Corporate 14,753 16,484 13,390
Total assets $ 7,935,011 $ 9,276,137 $ 9,175,164
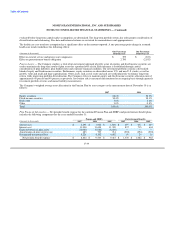
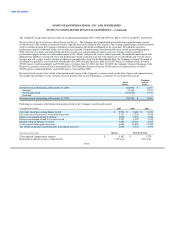
Geographic areas — Foreign operations are located principally in Europe. Foreign revenues are defined as revenues generated from
money transfer transactions originating in a country other than the United States. Long lived assets are principally located in the United
States. The table below presents revenue by major geographic area for the year ended December 31:
(Amounts in thousands) 2007 2006 2005
United States $ (142,766) $ 918,820 $ 789,410
Foreign 300,303 240,739 181,826
Total revenue $ 157,537 $ 1,159,559 $ 971,236
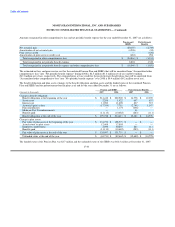
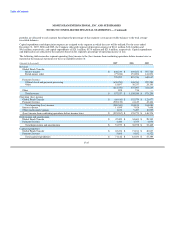
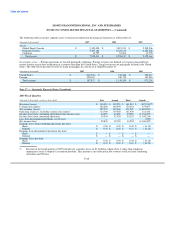
Note 17 — Quarterly Financial Data (Unaudited)
2007 Fiscal Quarters
(Amounts in thousands, except per share data) First Second Third Fourth
Revenues (losses) $ 310,051 $ 333,259 $ 341,581 $ (827,354)(1)
Commission expense 152,260 165,599 170,352 175,697
Net revenues (losses) 157,791 167,660 171,229 (1,003,051)
Operating expenses, excluding commission expense 113,700 119,780 121,970 131,446
Income (loss) from continuing operations before income taxes 44,091 47,880 49,259 (1,134,497)
Income (loss) from continuing operations 29,839 32,359 34,292 (1,168,238)
Loss from discontinued operations, net of taxes — — — (249)
Net income (loss) 29,839 32,359 34,292 (1,168,487)
Earnings (loss) from continuing operations per share
Basic $ 0.36 $ 0.39 $ 0.42 $ (14.18)
Diluted $ 0.35 $ 0.38 $ 0.41 $ (14.18)
Earnings from discontinued operations per share
Basic $ — $ — $ — $ —
Diluted $ — $ — $ — $ —
Earnings (loss) per share
Basic $ 0.36 $ 0.39 $ 0.42 $ (14.18)
Diluted $ 0.35 $ 0.38 $ 0.41 $ (14.18)
(1) Revenue in the fourth quarter of 2007 includes net securities losses of $1.2 billion, which relate to other-than-temporary
impairments in the Company's investment portfolio. This amount is also reflected in Net revenues and Loss from continuing
operations and Net loss.
F-48