MoneyGram 2007 Annual Report Download - page 39
Download and view the complete annual report
Please find page 39 of the 2007 MoneyGram annual report below. You can navigate through the pages in the report by either clicking on the pages listed below, or by using the keyword search tool below to find specific information within the annual report.-
 1
1 -
2
-
3
-
4
-
5
-
6
-
7
-
8
-
9
-
10
-
11
-
12
-
13
-
14
-
15
-
16
-
17
-
18
-
19
-
20
-
21
-
22
-
23
-
24
-
25
-
26
-
27
-
28
-
 29
29 -
 30
30 -
 31
31 -
 32
32 -
 33
33 -
 34
34 -
 35
35 -
 36
36 -
 37
37 -
 38
38 -
 39
39 -
 40
40 -
 41
41 -
 42
42 -
 43
43 -
 44
44 -
 45
45 -
 46
46 -
 47
47 -
 48
48 -
 49
49 -
50
-
51
-
52
-
53
-
54
-
55
-
56
-
57
-
58
-
59
-
60
-
61
-
62
-
63
-
64
-
65
-
66
-
67
-
68
-
69
-
70
-
71
-
72
-
73
-
74
-
75
-
76
-
77
-
78
-
79
-
80
-
81
-
82
-
83
-
84
-
85
-
86
-
87
-
88
-
89
-
90
-
91
-
92
-
93
-
94
-
95
-
96
-
97
-
98
-
99
-
100
-
101
-
102
-
103
-
104
-
105
-
106
-
107
-
108
-
109
-
110
-
111
-
112
-
113
-
114
-
115
-
116
-
117
-
118
-
119
-
120
-
121
-
122
-
123
-
124
-
125
-
126
-
127
-
128
-
129
-
130
-
131
-
132
-
133
-
134
-
135
-
136
-
137
-
138
-
139
-
140
-
141
-
142
-
143
-
144
-
145
-
146
-
147
-
148
-
149
-
150
-
151
-
152
-
153
-
154
-
155
-
156
-
157
-
158
-
159
-
160
-
161
-
162
-
163
-
164
 |
 |

Table of Contents
ACH Commerce — The Company purchased ACH Commerce, LLC ("ACH Commerce") in April 2005 for $8.5 million, of which
$1.1 million was to be paid upon the second anniversary of the acquisition. Based on the terms of the acquisition agreement, the
Company paid this amount during the second quarter of 2007.
Game Financial Corporation — In 2005, the Company recorded a gain of $0.7 million (net of tax) due to the partial resolution of
contingencies relating to the sale of Game Financial Corporation, ("Game Financial") which was completed in 2004. During 2007, the
Company paid $3.3 million in connection with the settlement of a contingency in the Sales and Purchase Agreement related to the
continued operations of Game Financial with one casino. We recognized a loss from discontinued operations of $0.3 million in the
Consolidated Statements of (Loss) Income in 2007, representing the recognition of a deferred tax asset valuation allowance partially
offset by the reversal of the remaining liability.
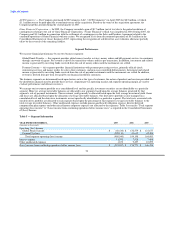
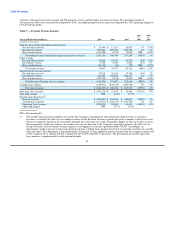
Segment Performance
We measure financial performance by our two business segments:
Global Funds Transfer — this segment provides global money transfer services, money orders and bill payment services to consumers
through a network of agents. Fee revenue is driven by transaction volume and fees per transaction. In addition, investment and related
income is generated by investing funds received from the sale of money orders until the instruments are settled.
Payment Systems — this segment provides financial institutions with payment processing services, primarily official check
outsourcing services and money orders for sale to their customers, and processes controlled disbursements. Investment and related
income is generated by investing funds received from the sale of payment instruments until the instruments are settled. In addition,
revenue is derived from per-item fees paid by our financial institution customers.
The business segments are determined based upon factors such as the type of customers, the nature of products and services provided and
the distribution channels used to provide those services. Segment pre-tax operating income and segment operating margin are used to
evaluate performance and allocate resources.
We manage our investment portfolio on a consolidated level and the specific investment securities are not identifiable to a particular
segment. However, average investable balances are allocated to our segments based upon the average balances generated by that
segment's sale of payment instruments. The investment yield generally is allocated based upon the total average investment yield. Gains
and losses are allocated based upon the allocation of average investable balances. Our derivatives portfolio is also managed on a
consolidated level and the derivative instruments are not specifically identifiable to a particular segment. The total costs associated with
our derivatives portfolio are allocated to each segment based upon the percentage of that segment's average investable balances to the
total average investable balances. Other unallocated expenses include pension and benefit obligation expense, director deferred
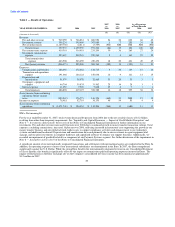
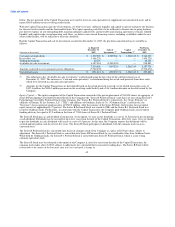
compensation plan expense and other miscellaneous corporate expenses not allocated to the segments. Table 5 reconciles "Total segment
operating (loss) income" to "(Loss) income from continuing operations before income taxes" as reported in the Consolidated Statements
of (Loss) Income.
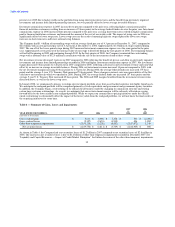
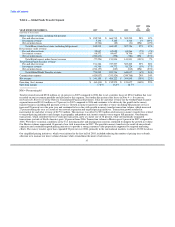
Table 5 — Segment Information
YEAR ENDED DECEMBER 31, 2007 2006 2005
(Amounts in thousands)
Operating (loss) income:
Global Funds Transfer $ (60,410) $ 152,579 $ 121,677
Payment Systems (920,130) 41,619 42,406
Total segment operating (loss) income (980,540) 194,198 164,083
Interest expense 11,055 7,928 7,608
Other unallocated expenses 1,672 9,497 10,099
(Loss) income from continuing operations before income taxes $ (993,267) $ 176,773 $ 146,376
36