MoneyGram 2007 Annual Report Download - page 46
Download and view the complete annual report
Please find page 46 of the 2007 MoneyGram annual report below. You can navigate through the pages in the report by either clicking on the pages listed below, or by using the keyword search tool below to find specific information within the annual report.-
 1
1 -
2
-
3
-
4
-
5
-
6
-
7
-
8
-
9
-
10
-
11
-
12
-
13
-
14
-
15
-
16
-
17
-
18
-
19
-
20
-
21
-
22
-
23
-
24
-
25
-
26
-
27
-
28
-
29
-
30
-
31
-
32
-
33
-
34
-
35
-
 36
36 -
 37
37 -
 38
38 -
 39
39 -
 40
40 -
 41
41 -
 42
42 -
 43
43 -
 44
44 -
 45
45 -
 46
46 -
 47
47 -
 48
48 -
 49
49 -
 50
50 -
 51
51 -
 52
52 -
 53
53 -
 54
54 -
 55
55 -
 56
56 -
57
-
58
-
59
-
60
-
61
-
62
-
63
-
64
-
65
-
66
-
67
-
68
-
69
-
70
-
71
-
72
-
73
-
74
-
75
-
76
-
77
-
78
-
79
-
80
-
81
-
82
-
83
-
84
-
85
-
86
-
87
-
88
-
89
-
90
-
91
-
92
-
93
-
94
-
95
-
96
-
97
-
98
-
99
-
100
-
101
-
102
-
103
-
104
-
105
-
106
-
107
-
108
-
109
-
110
-
111
-
112
-
113
-
114
-
115
-
116
-
117
-
118
-
119
-
120
-
121
-
122
-
123
-
124
-
125
-
126
-
127
-
128
-
129
-
130
-
131
-
132
-
133
-
134
-
135
-
136
-
137
-
138
-
139
-
140
-
141
-
142
-
143
-
144
-
145
-
146
-
147
-
148
-
149
-
150
-
151
-
152
-
153
-
154
-
155
-
156
-
157
-
158
-
159
-
160
-
161
-
162
-
163
-
164
 |
 |
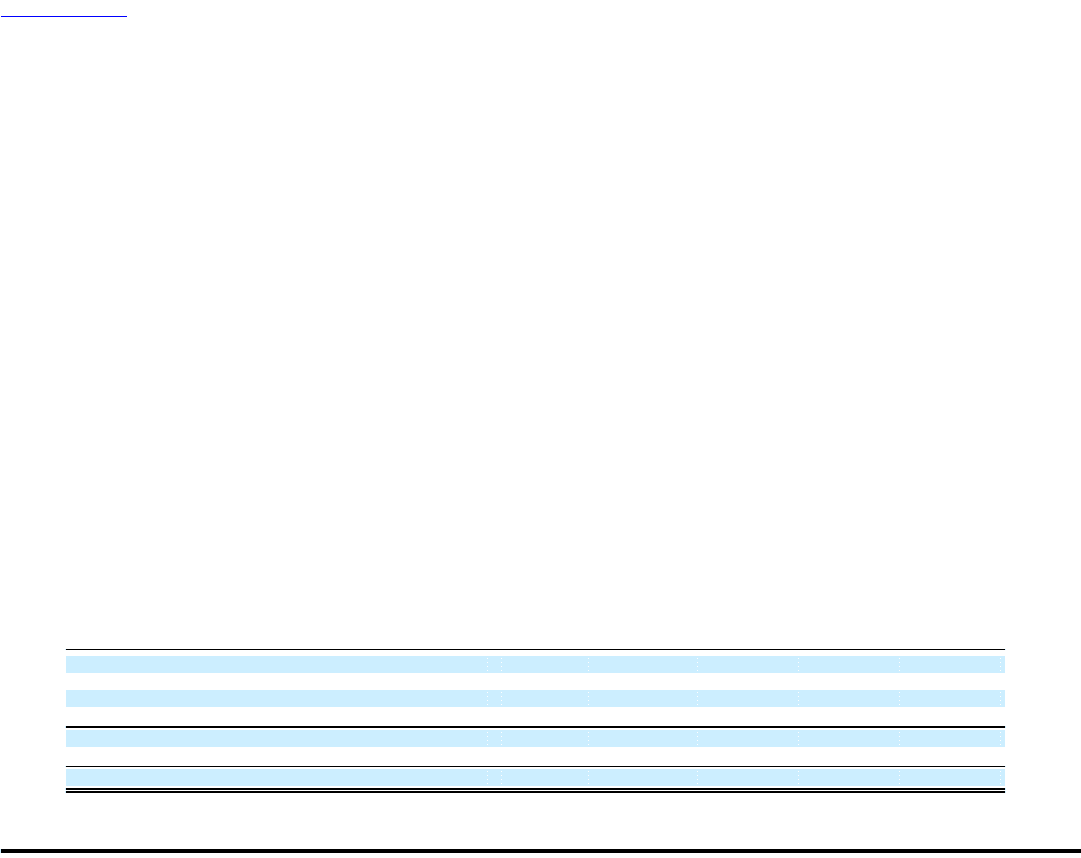
Table of Contents
substantially lower rate of decline in fair value. We continued to closely monitor the performance of our investments, market
developments and the impact of rating agency actions on our portfolio. With few exceptions, our investments continued to provide for all
contractual cash flows and evidenced little, if any, actual losses from defaults through early November 2007. As a result, through early
November 2007, we believed we had sufficient unrestricted assets to maintain compliance with all of our contractual and regulatory
requirements through any further market deterioration. As the unrealized losses on the investment portfolio had no immediate impact on
our cash flows, there was no disruption to our operating liquidity.
In late November and December 2007, the asset-backed securities and credit markets experienced further substantial deterioration under
increasing concerns over defaults on mortgages and debt in general, as well as an increasingly negative view of all structured investments
and the credit market in general. This deterioration caused the market to demand higher risk premiums and liquidity discounts on asset-
backed securities, as well as assume higher rates of defaults than previously anticipated through October 2007. As a result of these market
developments, the fair value for asset-backed securities as of November 30, 2007 substantially declined by an additional $571.2 million
from September 30, 2007. In addition, the rating agencies continued their review of securities, issuing broad rating downgrades based on
high levels of assumed future defaults. Under the terms of certain of our asset-backed securities, ratings downgrades of collateral
securities can reduce the cash flows to all but the most senior investors even if there have been no actual losses incurred by the collateral
securities. In December 2007, we began to experience adverse changes to the cash flows from some of our asset-backed investments as a
result of the accumulating rating downgrades of the underlying collateral securities.
As the market continued its substantial deterioration in December 2007, we identified a need for additional capital as we anticipated that
we would not be in compliance with our Total Company Ratio and our Debt Covenants as of December 31, 2007. Through meetings with
potential investors in late December 2007 and early January 2008, it became evident that we would need to divest certain investments in
connection with any recapitalization to substantially reduce the risk of any further deterioration in the investment portfolio. We
commenced a plan in January 2008 to realign our investment portfolio away from asset-backed securities and into highly liquid assets
through the sale of a substantial portion of the investment portfolio. Based on these developments, we determined that we no longer had
the intent to "hold until maturity or call" substantially all of our investments classified as "Obligations of states and political
subdivisions," "Commercial mortgage-backed securities," "Residential mortgage-backed securities," "Other asset-backed securities,"
"Corporate debt securities" and "Preferred and common stock."
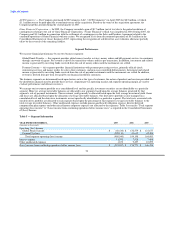
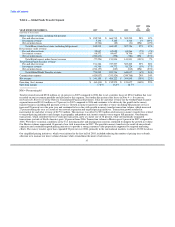
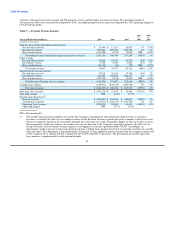
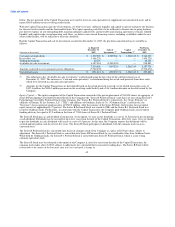
As a result of these developments, we recognized $1.2 billion of other-than-temporary impairments in December 2007, causing a shortfall
in unrestricted assets. Following are the unrestricted assets as of:
Table 8 — Unrestricted Assets
December 31, September 30, June 30, March 31, December 31,
(Amounts in thousands) 2007 2007 2007 2007 2006
Cash and cash equivalents (substantially restricted) $ 1,552,949 $ 1,152,993 $ 987,918 $ 1,274,768 $ 973,931
Receivables, net (substantially restricted) 1,408,220 1,717,464 1,775,431 1,599,654 1,758,682
Trading investments (substantially restricted) 62,105 62,300 121,200 107,000 145,500
Available for sale investments (substantially restricted) 4,187,384 5,260,296 5,624,054 5,490,141 5,690,600
7,210,658 8,193,053 8,508,603 8,471,563 8,568,713
Amounts restricted to cover payment service obligations (7,762,470) (7,907,393) (8,211,535) (8,129,757) (8,209,789)
(Shortfall) excess of unrestricted assets $ (551,812) $ 285,660 $ 297,068 $ 341,806 $ 358,924
43