MoneyGram 2007 Annual Report Download - page 36
Download and view the complete annual report
Please find page 36 of the 2007 MoneyGram annual report below. You can navigate through the pages in the report by either clicking on the pages listed below, or by using the keyword search tool below to find specific information within the annual report.-
 1
1 -
2
-
3
-
4
-
5
-
6
-
7
-
8
-
9
-
10
-
11
-
12
-
13
-
14
-
15
-
16
-
17
-
18
-
19
-
20
-
21
-
22
-
23
-
24
-
25
-
 26
26 -
 27
27 -
 28
28 -
 29
29 -
 30
30 -
 31
31 -
 32
32 -
 33
33 -
 34
34 -
 35
35 -
 36
36 -
 37
37 -
 38
38 -
 39
39 -
 40
40 -
 41
41 -
 42
42 -
 43
43 -
 44
44 -
 45
45 -
 46
46 -
47
-
48
-
49
-
50
-
51
-
52
-
53
-
54
-
55
-
56
-
57
-
58
-
59
-
60
-
61
-
62
-
63
-
64
-
65
-
66
-
67
-
68
-
69
-
70
-
71
-
72
-
73
-
74
-
75
-
76
-
77
-
78
-
79
-
80
-
81
-
82
-
83
-
84
-
85
-
86
-
87
-
88
-
89
-
90
-
91
-
92
-
93
-
94
-
95
-
96
-
97
-
98
-
99
-
100
-
101
-
102
-
103
-
104
-
105
-
106
-
107
-
108
-
109
-
110
-
111
-
112
-
113
-
114
-
115
-
116
-
117
-
118
-
119
-
120
-
121
-
122
-
123
-
124
-
125
-
126
-
127
-
128
-
129
-
130
-
131
-
132
-
133
-
134
-
135
-
136
-
137
-
138
-
139
-
140
-
141
-
142
-
143
-
144
-
145
-
146
-
147
-
148
-
149
-
150
-
151
-
152
-
153
-
154
-
155
-
156
-
157
-
158
-
159
-
160
-
161
-
162
-
163
-
164
 |
 |

Table of Contents
Compared to the $2.8 million of net securities losses recorded in 2006, the Company had net securities losses of $3.7 million in 2005,
primarily due to lower realized losses and lower impairments. Net securities losses of $2.8 million recorded in 2006 include impairments
related to investments backed by automobile, aircraft, manufactured housing, bank loans and insurance securities collateral. Impairments
in 2005 related primarily to investments backed by aircraft and manufactured housing collateral.
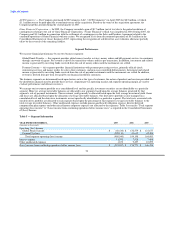
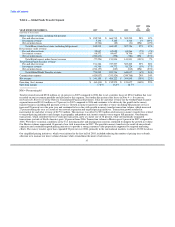
Expenses
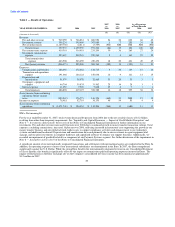
Expenses represent operating expenses other than commissions. Following is a discussion of the operating expenses presented in Table 1.
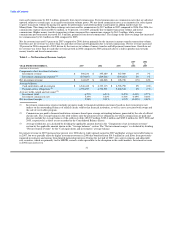
Compensation and benefits — Compensation and benefits includes salaries and benefits, management incentive programs and other
employee related costs. Compensation and benefits increased $15.8 million, or 9 percent, in 2007 compared to 2006, resulting primarily
from an increase in salaries and benefits of $31.4 million, partially offset by a decrease of $16.7 million in incentive compensation
accruals. The increase in salaries and benefits is primarily due to a $24.6 million increase in salaries due to higher headcount supporting
the growth of the money transfer business, a $2.5 million increase in medical costs and a $2.4 million increase in payroll taxes. Incentive
compensation decreased $18.6 million due to the Company's 2007 performance and stock price decline, offset by a $2.0 million increase
in stock-based compensation expense. The increase in stock based compensation expense is due primarily to the high value of the
Company's stock price at the date of the 2007 grants, partially offset by a lower number of awards being earned in the current year. The
change in the Euro exchange rate, which is reflected in each of the amounts discussed above, increased compensation and benefits by
approximately $1.4 million compared to 2006. As of December 31, 2007, the number of employees increased 10 percent over 2006 as we
increased headcount for our support functions and continued to staff our retail locations in France and Germany. We expect to see a
double-digit increase in headcount in 2008, resulting in continued increases to compensation and benefits.
Compensation and benefits increased $39.5 million, or 30 percent, in 2006 compared to 2005, primarily driven by the hiring of additional
personnel, resulting in an increase in salary expense of $22.6 million, higher performance incentive accruals of $7.1 million and an
increase of $1.6 million of stock-based compensation expense. In 2006, the number of employees increased by 21 percent over 2005 to
drive and support money transfer growth.
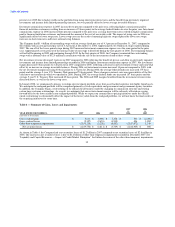
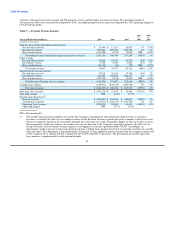
Transaction and operations support — Transaction and operations support expenses include marketing costs, professional fees and other
outside services costs, telecommunications and forms expense related to our products. Transaction and operations support costs increased
$26.9 million, or 16 percent, in 2007 compared to 2006, primarily due to higher costs related to the expansion of the money transfer
business and the global network, as well as an impairment of $6.4 million of goodwill related to a component of our Payment Systems
segment. See further discussion of the impairment recorded in Note 8 — Intangibles and Goodwill of the Notes to Consolidated Financial
Statements. Provision for loss increased in 2007 by $4.6 million over 2006, with no noticeable trends driving the increase. As our agent
base and transaction volumes continue to grow, we expect that provision for loss will increase; however, we expect this growth to be
much slower than agent base and transaction growth due to our underwriting and credit monitoring processes. Professional fees increased
$5.3 million primarily due to increased contractor and consulting fees to support compliance activities and enhancements to our
technology systems and increased credit servicing fees. Marketing costs increased $3.2 million, agent forms and supplies costs increased
$2.7 million and licensing fees increased by $2.5 million, all primarily due to the increase in agent locations. These increases were offset
by a decrease of $4.1 million in the directors deferred compensation accrual related to the decrease in the price of our common stock. The
change in the Euro exchange rate, which is reflected in each of the amounts discussed above, increased transaction and operations support
by approximately $6.0 million compared to 2006.
Transaction and operations support costs were up $14.1 million, or nine percent, in 2006 compared to 2005, primarily driven by an
increase of $15.0 million in marketing expenditures as we continue to invest in our brand and support our agent growth and an increase of
$9.0 million in professional fees to support enhancements to our technology systems. These increases were partially offset by a
$9.0 million decline in provision for uncollectible receivables primarily resulting from the additional provision of $6.7 million in 2005 for
one agent. In addition, in 2006, we recognized an impairment of $0.9 million due to the discontinuation of a software development
project.
33