MoneyGram 2007 Annual Report Download - page 42
Download and view the complete annual report
Please find page 42 of the 2007 MoneyGram annual report below. You can navigate through the pages in the report by either clicking on the pages listed below, or by using the keyword search tool below to find specific information within the annual report.-
 1
1 -
2
-
3
-
4
-
5
-
6
-
7
-
8
-
9
-
10
-
11
-
12
-
13
-
14
-
15
-
16
-
17
-
18
-
19
-
20
-
21
-
22
-
23
-
24
-
25
-
26
-
27
-
28
-
29
-
30
-
31
-
 32
32 -
 33
33 -
 34
34 -
 35
35 -
 36
36 -
 37
37 -
 38
38 -
 39
39 -
 40
40 -
 41
41 -
 42
42 -
 43
43 -
 44
44 -
 45
45 -
 46
46 -
 47
47 -
 48
48 -
 49
49 -
 50
50 -
 51
51 -
 52
52 -
53
-
54
-
55
-
56
-
57
-
58
-
59
-
60
-
61
-
62
-
63
-
64
-
65
-
66
-
67
-
68
-
69
-
70
-
71
-
72
-
73
-
74
-
75
-
76
-
77
-
78
-
79
-
80
-
81
-
82
-
83
-
84
-
85
-
86
-
87
-
88
-
89
-
90
-
91
-
92
-
93
-
94
-
95
-
96
-
97
-
98
-
99
-
100
-
101
-
102
-
103
-
104
-
105
-
106
-
107
-
108
-
109
-
110
-
111
-
112
-
113
-
114
-
115
-
116
-
117
-
118
-
119
-
120
-
121
-
122
-
123
-
124
-
125
-
126
-
127
-
128
-
129
-
130
-
131
-
132
-
133
-
134
-
135
-
136
-
137
-
138
-
139
-
140
-
141
-
142
-
143
-
144
-
145
-
146
-
147
-
148
-
149
-
150
-
151
-
152
-
153
-
154
-
155
-
156
-
157
-
158
-
159
-
160
-
161
-
162
-
163
-
164
 |
 |
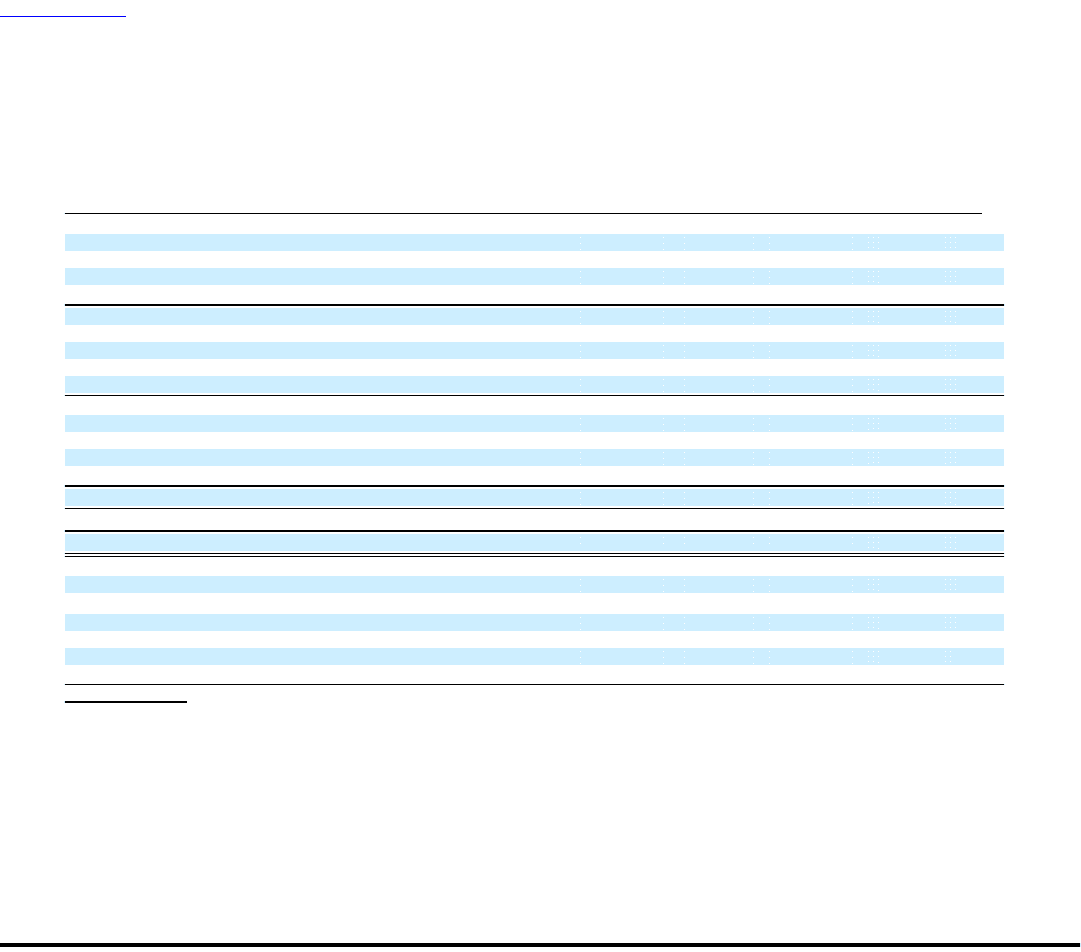
Table of Contents
year due to the growth in money transfer and bill payment services and the higher investment revenue. The operating margin of
18.6 percent in 2006 was essentially flat compared to 2005. An additional provision for agent loss impacted the 2005 operating margin by
(0.9) percentage points.
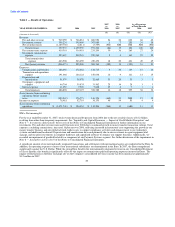
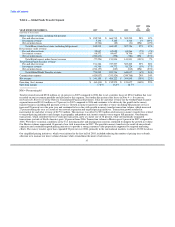
Table 7 — Payment Systems Segment
2007 2006
vs. vs.
YEAR ENDED DECEMBER 31, 2007 2006 2005 2006 2005
(Amounts in thousands)
Official check and payment processing revenue
Fee and other revenue $ 13,546 $ 13,211 18,007 3% (27%)
Investment revenue 299,681 295,703 282,127 1% 5%
Net securities losses (943,480) (2,154) (2,845) NM (24%)
Total official check and payment processing (losses) revenue (630,253) 306,760 297,289 (305%) 3%
Other revenue
Fee and other revenue 23,468 25,432 19,742 (8%) 29%
Investment revenue 4,548 4,939 4,640 (8%) 6%
Net securities losses (12,119) (34) (52) NM (35%)
Total other revenue 15,897 30,337 24,330 (48%) 25%
Total Payment Systems revenue
Fee and other revenue 37,014 38,643 37,749 (4%) 2%
Investment revenue 304,229 300,642 286,767 1% 5%
Net securities losses (955,599) (2,188) (2,897) NM (24%)
Total Payment Systems (losses) revenue (614,356) 337,097 321,619 (282%) 5%
Commissions expense (234,071) (230,135) (220,704) 2% 4%
Net (loss) revenue $ (848,427) $ 106,962 $ 100,915 (893%) 6%
Operating (loss) income $ (920,130) $ 41,619 $ 42,406 (2311%) (2%)
Operating margin NM 12.3% 13.2%
Taxable equivalent basis(1):
(Losses) revenue $ (598,247) $ 354,544 $ 340,655 (269%) 4%
Commissions expense $ (234,071) $ (230,135) $ (220,704) 2% 4%
Operating (loss) income (904,020) 59,064 61,441 (1631%) (4%)
Operating margin NM 16.7% 18.0%
NM = Not meaningful
(1) The taxable equivalent basis numbers are used by the Company's management, and management believes they are useful to
investors, to evaluate the effect of tax-exempt securities on the Payment Systems segment and on the Company's effective tax rate.
The tax-exempt investments in the investment portfolio have lower pre-tax yields, but produce higher income on an after-tax basis
than comparable taxable investments. As income taxes are not allocated to the Company's operating segments, the effect of tax-
exempt securities on the Payment Systems segment is not apparent in measures presented under GAAP. Accordingly, an
adjustment is made to present revenue and operating income resulting from amounts invested in tax-exempt securities on a taxable
equivalent basis. The adjustment is calculated using a 35 percent tax rate applied to interest income from tax-exempt securities and
is $16.1 million, $17.4 million and $19.0 million for 2007, 2006 and 2005, respectively. The presentation of taxable equivalent
basis numbers is supplemental to results presented under
39