MoneyGram 2007 Annual Report Download - page 43
Download and view the complete annual report
Please find page 43 of the 2007 MoneyGram annual report below. You can navigate through the pages in the report by either clicking on the pages listed below, or by using the keyword search tool below to find specific information within the annual report.-
 1
1 -
2
-
3
-
4
-
5
-
6
-
7
-
8
-
9
-
10
-
11
-
12
-
13
-
14
-
15
-
16
-
17
-
18
-
19
-
20
-
21
-
22
-
23
-
24
-
25
-
26
-
27
-
28
-
29
-
30
-
31
-
32
-
 33
33 -
 34
34 -
 35
35 -
 36
36 -
 37
37 -
 38
38 -
 39
39 -
 40
40 -
 41
41 -
 42
42 -
 43
43 -
 44
44 -
 45
45 -
 46
46 -
 47
47 -
 48
48 -
 49
49 -
 50
50 -
 51
51 -
 52
52 -
 53
53 -
54
-
55
-
56
-
57
-
58
-
59
-
60
-
61
-
62
-
63
-
64
-
65
-
66
-
67
-
68
-
69
-
70
-
71
-
72
-
73
-
74
-
75
-
76
-
77
-
78
-
79
-
80
-
81
-
82
-
83
-
84
-
85
-
86
-
87
-
88
-
89
-
90
-
91
-
92
-
93
-
94
-
95
-
96
-
97
-
98
-
99
-
100
-
101
-
102
-
103
-
104
-
105
-
106
-
107
-
108
-
109
-
110
-
111
-
112
-
113
-
114
-
115
-
116
-
117
-
118
-
119
-
120
-
121
-
122
-
123
-
124
-
125
-
126
-
127
-
128
-
129
-
130
-
131
-
132
-
133
-
134
-
135
-
136
-
137
-
138
-
139
-
140
-
141
-
142
-
143
-
144
-
145
-
146
-
147
-
148
-
149
-
150
-
151
-
152
-
153
-
154
-
155
-
156
-
157
-
158
-
159
-
160
-
161
-
162
-
163
-
164
 |
 |

Table of Contents
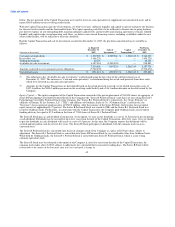
GAAP and may not be comparable to similarly titled measures used by other companies. These non-GAAP measures should be
used in addition to, but not as a substitute for measures presented under GAAP.
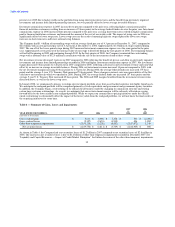
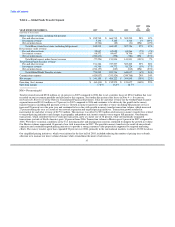
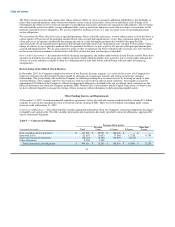
Total revenue includes investment revenue, net securities gains and losses, per-item fees charged to our official check financial institution
customers and fees earned on our rebate processing business. Total net loss in the Payment Systems segment of $614.4 million for 2007
reflects net securities losses of $955.6 million that were recorded on our investment portfolio. See further discussion of the losses in
"Liquidity and Capital Resources — Impact of Credit Market Disruption" and Note 4 — Investments (Substantially Restricted) of the
Notes to Consolidated Financial Statements. Total revenue for 2006 includes $10.9 million of cash flows from previously impaired
securities and income from limited partnership interests. Such cash flows were nominal for 2007. Total revenue increased five percent in
2006 compared to 2005 due primarily to higher investment revenue from higher yields earned on the portfolio from the increase in short-
term interest rates.
Commissions expense includes payments made to financial institution customers based on official check average investable balances and
short-term interest rate indices, as well as costs associated with swaps and the sale of receivables program. Commissions expense
increased two percent in 2007, primarily due to higher commissions paid to financial institution customers resulting from an increase in
the average federal funds rate over the prior year, as well as the run-off of interest rate swaps. Commissions expense increased four
percent in 2006, primarily due to higher commissions paid to financial institutions as short-term interest rates increased. Commissions
expense as a percentage of investment revenue was 77 percent for all years presented.
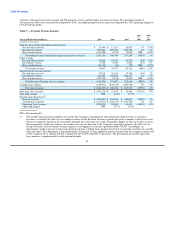
The operating loss for 2007 was $920.1 million, reflecting the net securities losses of $955.6 million resulting from other-than-temporary
impairment charges recognized on the investment portfolio and a goodwill impairment charge of $6.4 million relating to one component
of the Payment Systems segment. After considering the net securities losses and goodwill impairment charge, the operating margin for
2007 declined 70 basis points from 2006 due primarily to the run-off of interest rate swaps. The operating margin in 2006 decreased to
12.3 percent (16.7 percent on a taxable equivalent basis) as compared to 2005 operating margin of 13.2 percent (18.0 percent on a taxable
equivalent basis), primarily due to lower average investable balances and a $0.9 million charge for the discontinuance of a development
project. The cash flows from previously impaired securities, income from limited partnership interests and termination fee contributed a
combined 2.6 percentage points and 4.9 percentage points, respectively, to the operating margin in each of 2006 and 2005.
In late 2007, MoneyGram conducted a comprehensive review of the Payment Systems segment. As a result of this review, the Company
has begun to restructure its official check business model by changing its commission structure and exiting certain large customer
relationships. This restructuring will enable the Company to continue providing these essential services by focusing on small- to mid-
sized institutions. The Company expects to exit contracts with most of its top ten official check customers, who together account for
approximately $2 billion of the Company's official check payment obligations, thereby significantly reducing our official check business.
Also impacting the Payment Systems segment is the process commenced in January 2008 to realign our investment portfolio away from
asset-backed securities into highly liquid assets. We anticipate that the realigned portfolio will be comprised primarily of cash
equivalents, government and government agency securities. As a result, we anticipate that our profit margins in the official check
business will be adversely affected by the lower yields in our realigned portfolio. While we expect our commission re-pricing initiatives
under the official check restructuring to fully offset the impact of the lower yields from the realigned portfolio, we will not know the final
results of the re-pricing initiatives for some time.
LIQUIDITY AND CAPITAL RESOURCES
One of our primary financial goals is to maintain adequate liquidity to manage the fluctuations in the balances of payment service assets
and obligations resulting from sales of official checks, money orders and other payment instruments, the timing of the collections of
receivables and the timing of the presentment of such instruments for payment. In addition, we strive to maintain adequate liquidity for
capital expenditures and other normal operating cash needs. Another primary financial goal is to maintain adequate capital to ensure the
on-going compliance with regulatory and contractual requirements through the fluctuations in the balances of our payment service assets
and obligations, particularly investments.
40