MoneyGram 2007 Annual Report Download - page 41
Download and view the complete annual report
Please find page 41 of the 2007 MoneyGram annual report below. You can navigate through the pages in the report by either clicking on the pages listed below, or by using the keyword search tool below to find specific information within the annual report.-
 1
1 -
2
-
3
-
4
-
5
-
6
-
7
-
8
-
9
-
10
-
11
-
12
-
13
-
14
-
15
-
16
-
17
-
18
-
19
-
20
-
21
-
22
-
23
-
24
-
25
-
26
-
27
-
28
-
29
-
30
-
 31
31 -
 32
32 -
 33
33 -
 34
34 -
 35
35 -
 36
36 -
 37
37 -
 38
38 -
 39
39 -
 40
40 -
 41
41 -
 42
42 -
 43
43 -
 44
44 -
 45
45 -
 46
46 -
 47
47 -
 48
48 -
 49
49 -
 50
50 -
 51
51 -
52
-
53
-
54
-
55
-
56
-
57
-
58
-
59
-
60
-
61
-
62
-
63
-
64
-
65
-
66
-
67
-
68
-
69
-
70
-
71
-
72
-
73
-
74
-
75
-
76
-
77
-
78
-
79
-
80
-
81
-
82
-
83
-
84
-
85
-
86
-
87
-
88
-
89
-
90
-
91
-
92
-
93
-
94
-
95
-
96
-
97
-
98
-
99
-
100
-
101
-
102
-
103
-
104
-
105
-
106
-
107
-
108
-
109
-
110
-
111
-
112
-
113
-
114
-
115
-
116
-
117
-
118
-
119
-
120
-
121
-
122
-
123
-
124
-
125
-
126
-
127
-
128
-
129
-
130
-
131
-
132
-
133
-
134
-
135
-
136
-
137
-
138
-
139
-
140
-
141
-
142
-
143
-
144
-
145
-
146
-
147
-
148
-
149
-
150
-
151
-
152
-
153
-
154
-
155
-
156
-
157
-
158
-
159
-
160
-
161
-
162
-
163
-
164
 |
 |

Table of Contents
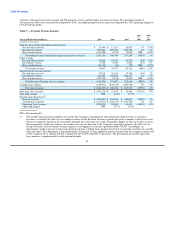
for our agents and customers. While simplified pricing initiatives have contributed to a lower average per transaction fee, we believe that
the initiatives have contributed to our volume growth as a simpler pricing process and lower overall fees attracts new customers. During
2007, the gap between total revenue growth and money transfer transaction growth narrowed as we lapped the first year of
implementation of simplified pricing initiatives.
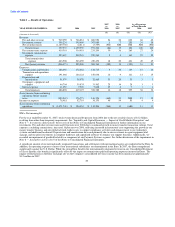
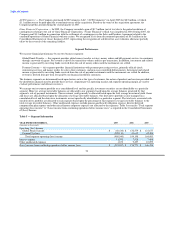
Total revenue increased 26 percent in 2006 compared to 2005, primarily driven by the growth in the money transfer and bill payment
services, as total transaction volume grew 41 percent. Transaction volume growth in money transfer and bill payment services increased
fee and other revenue by $196.5 million. Average per transaction fees in money transfer and bill payment services were lower in 2006,
reducing fee and other revenue by $56.7 million, primarily as a result of our simplified pricing initiative. In addition, average per
transaction fees were lower in 2006 than 2005 as a result of shifts in product and geographic origination mix. Money transfer and bill
payment transactions continued to drive fee and other revenue growth in 2006, while money order transactions, which have higher
margins, declined. Domestic originated transactions (including bill payment) grew 46 percent with growth across all corridors, while
international originated transactions grew 30 percent from 2005. Transaction volume to Mexico grew 29 percent in 2006 over 2005. Our
Mexico volume represented 11 percent and 12 percent of our total transactions in 2006 and 2005, respectively. In 2006, the money
transfer agent base expanded 24 percent over 2005, primarily in the international markets, to about 110,000 locations.
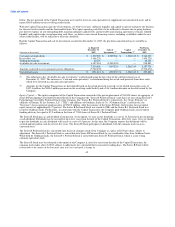
At December 31, 2007, money transfer agents are located in the following geographic regions: 33,300 locations in North America;
22,200 locations in Latin America (including Mexico, which represents 10,600 locations); 44,200 locations in Western Europe and the
Middle East; 10,800 locations in the Indian subcontinent; 13,600 locations in Asia Pacific; 13,700 locations in Eastern Europe and 5,200
locations in Africa.
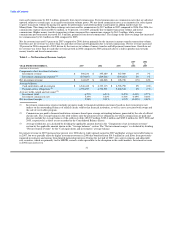
Fee and other revenue for retail money order decreased seven percent and two percent in 2007 and 2006, respectively, compared to the
prior year. These decreases are in line with declines in volume for both years. The Company expects to see a decline in money order fee
and other revenue of approximately 5 percent in 2008.
Investment revenue in the Global Funds Transfer segment decreased one percent in 2007 compared to 2006 due to lower average
investable balances and as 2006 benefited from $3.1 million of pre-tax cash flow on previously impaired investments and income from
limited partnership interests. Pre-tax cash flows in 2007 from previously impaired investments and income from limited partnership
interests was nominal. Partially offsetting these decreases was the benefit from wider spreads earned on our cash investments and
adjustable rate securities due to the disruption in the credit markets in the second half of 2007. Net securities losses in 2007 reflect other-
than-temporary impairments of $234.2 million that were recorded on our investment portfolio and allocated to this segment. See further
discussion of the losses in Note 4 — Investments (Substantially Restricted) and Note 18 — Subsequent Events of the Notes to
Consolidated Financial Statements. Investment revenue increased 17 percent in 2006 compared to 2005 primarily due to higher average
yields which were partially offset by lower average investable balances. Net securities losses were flat in 2006 compared to 2005.
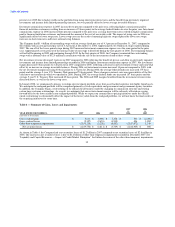
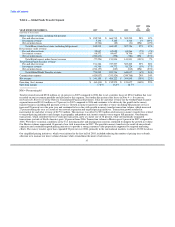
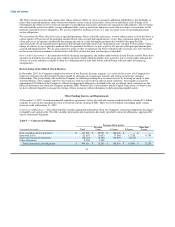
Commissions expense in 2007 was up 29 percent compared to 2006, primarily driven by tiered commission rates paid to certain agents
and increases in the Euro exchange rate. Tiered commissions are commission rates that are adjusted upward, subject to certain caps, as an
agent's transaction volume grows. We use tiered commission rates as an incentive for select agents to grow transaction volume by paying
the agents for performance and allowing the agent to participate in adding market share for MoneyGram. Our largest agent, Wal-Mart,
achieved new tiers in the third quarter of 2006 and the fourth quarter of 2007. In conjunction with our Capital Transaction, we extended
the term of the current agreement with Wal-Mart through January 2013 and agreed to certain commission increases over the extended
term of the contract. See further discussion of the Capital Transaction in Note 18 — Subsequent Events of the Notes to Consolidated
Financial Statements and in "Liquidity and Capital Resources — Sale of Investments and Capital Transaction." As compared to 2005,
commissions expense in 2006 was up 34 percent, primarily driven by the 28 percent growth in fee and other revenue. Commissions
expense as a percentage of revenue increased from 38.4 percent in 2005 to 40.6 percent in 2006, primarily due to tiered commission rates
paid to certain agents and product mix (as growth in the money transfer business outpaced money orders).
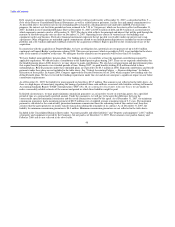
Operating loss of $60.4 million and operating margin of (7.8) percent in 2007 reflect the net securities losses of $234.2 million that were
recorded on our investment portfolio and allocated to this segment. The losses were partially offset by the growth in money transfer.
Operating income in 2006 increased 25 percent over the previous
38