MoneyGram 2007 Annual Report Download - page 34
Download and view the complete annual report
Please find page 34 of the 2007 MoneyGram annual report below. You can navigate through the pages in the report by either clicking on the pages listed below, or by using the keyword search tool below to find specific information within the annual report.-
 1
1 -
2
-
3
-
4
-
5
-
6
-
7
-
8
-
9
-
10
-
11
-
12
-
13
-
14
-
15
-
16
-
17
-
18
-
19
-
20
-
21
-
22
-
23
-
 24
24 -
 25
25 -
 26
26 -
 27
27 -
 28
28 -
 29
29 -
 30
30 -
 31
31 -
 32
32 -
 33
33 -
 34
34 -
 35
35 -
 36
36 -
 37
37 -
 38
38 -
 39
39 -
 40
40 -
 41
41 -
 42
42 -
 43
43 -
 44
44 -
45
-
46
-
47
-
48
-
49
-
50
-
51
-
52
-
53
-
54
-
55
-
56
-
57
-
58
-
59
-
60
-
61
-
62
-
63
-
64
-
65
-
66
-
67
-
68
-
69
-
70
-
71
-
72
-
73
-
74
-
75
-
76
-
77
-
78
-
79
-
80
-
81
-
82
-
83
-
84
-
85
-
86
-
87
-
88
-
89
-
90
-
91
-
92
-
93
-
94
-
95
-
96
-
97
-
98
-
99
-
100
-
101
-
102
-
103
-
104
-
105
-
106
-
107
-
108
-
109
-
110
-
111
-
112
-
113
-
114
-
115
-
116
-
117
-
118
-
119
-
120
-
121
-
122
-
123
-
124
-
125
-
126
-
127
-
128
-
129
-
130
-
131
-
132
-
133
-
134
-
135
-
136
-
137
-
138
-
139
-
140
-
141
-
142
-
143
-
144
-
145
-
146
-
147
-
148
-
149
-
150
-
151
-
152
-
153
-
154
-
155
-
156
-
157
-
158
-
159
-
160
-
161
-
162
-
163
-
164
 |
 |
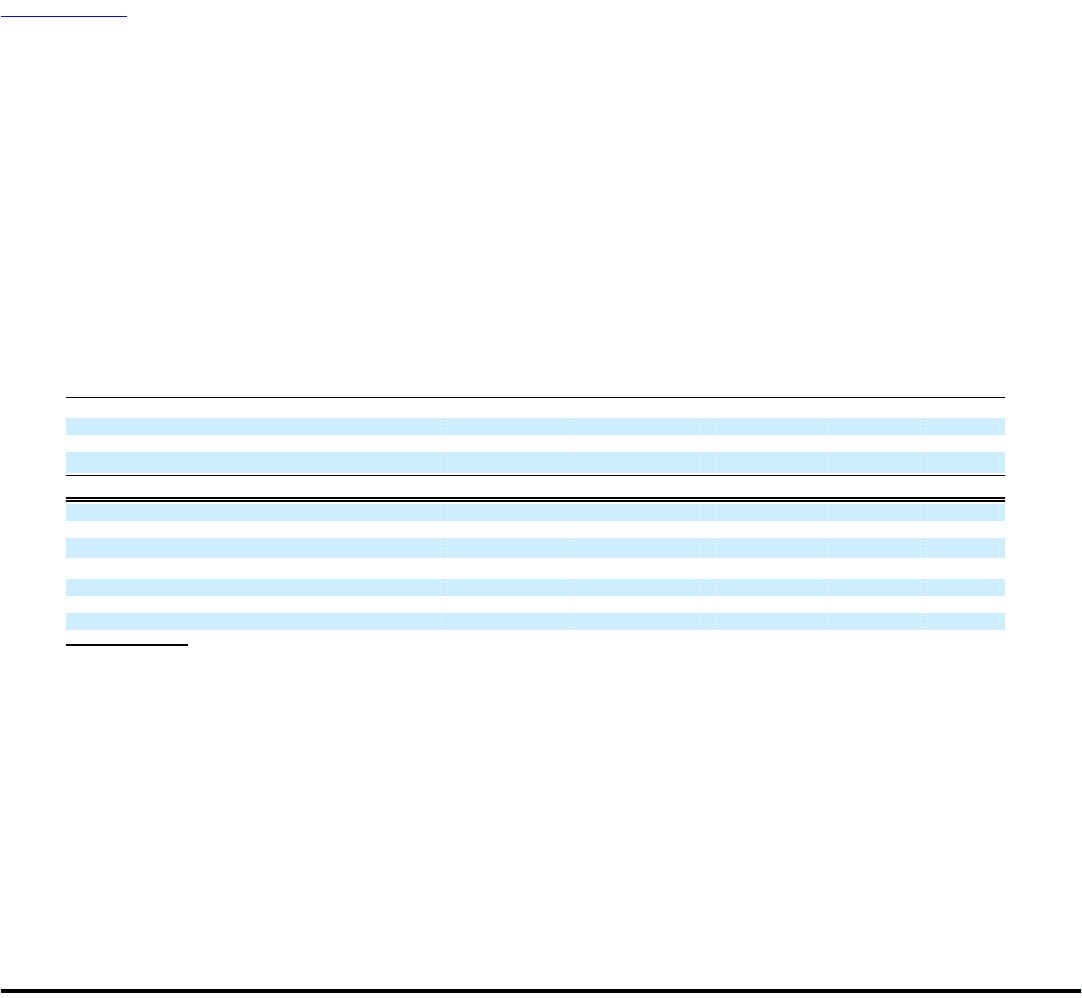
Table of Contents
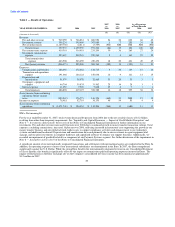
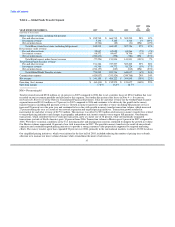
increased commissions by $10.2 million, primarily from tiered commissions. Tiered commissions are commission rates that are adjusted
upward, subject to certain caps, as an agent's transaction volume grows. We use tiered commission rates as an incentive for select agents
to grow transaction volume by paying our agents for performance and allowing them to participate in adding market share for
MoneyGram. The change in the Euro exchange rate increased fee commissions by $9.7 million in 2007 compared to 2006. For 2006, fee
commissions expense increased $83.2 million, or 36 percent, over 2005, primarily due to higher transaction volume and tiered
commissions. Higher money transfer transaction volumes increased fee commissions expense by $61.2 million, while average
commissions per transaction increased $13.0 million, primarily from tiered commissions. The change in the Euro exchange rate increased
fee commissions by $1.3 million in 2006 compared to 2005.
Net fee revenue increased 19 percent in 2007 compared to 2006, driven primarily by the increase in money transfer transaction volume.
Growth in net fee revenue was lower than fee and other revenue growth primarily due to tiered commissions. Net fee revenue increased
20 percent in 2006 compared to 2005, driven by the increase in volume of money transfer and bill payment transactions. Growth in net
fee revenue was lower than fee and other revenue growth in 2006 compared to 2005, primarily due to a shift in product mix towards
money transfer and tiered commissions.
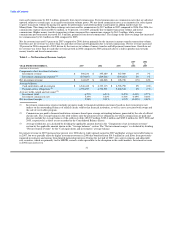
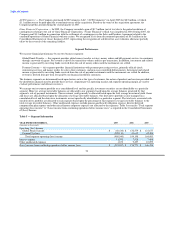
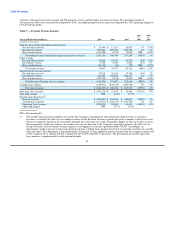
Table 3 — Net Investment Revenue Analysis
2007 2006
vs. vs.
YEAR ENDED DECEMBER 31, 2007 2006 2005 2006 2005
(Amounts in thousands)
Components of net investment revenue:
Investment revenue $ 398,234 $ 395,489 $ 367,989 1% 7%
Investment commissions expense (1) (253,607) (249,241) (239,263) 2% 4%
Net investment revenue $ 144,627 $ 146,248 $ 128,726 (1%) 14%
Average balances:
Cash equivalents and investments $ 6,346,442 $ 6,333,115 $ 6,726,790 0% (6%)
Payment service obligations (2) 4,796,257 4,796,538 5,268,512 0% (9%)
Average yields earned and rates paid (3):
Investment yield 6.27% 6.24% 5.47% 0.03% 0.77%
Investment commission rate 5.29% 5.20% 4.54% 0.09% 0.66%
Net investment margin 2.28% 2.31% 1.91% (0.03%) 0.40%
(1) Investment commissions expense includes payments made to financial institution customers based on short-term interest rate
indices on the outstanding balances of official checks sold by that financial institution, as well as costs associated with swaps and
the sale of receivables program.
(2) Commissions are paid to financial institution customers based upon average outstanding balances generated by the sale of official
checks only. The average balance in the table reflects only the payment service obligations for which commissions are paid and
does not include the average balance of the sold receivables ($349.9 million, $382.6 million and $389.8 million for 2007, 2006 and
2005, respectively) as these are not recorded in the Consolidated Balance Sheets.
(3) Average yields/rates are calculated by dividing the applicable amount shown in the "Components of net investment revenue"
section by the applicable amount shown in the "Average balances" section. The "Net investment margin" is calculated by dividing
"Net investment revenue" by the "Cash equivalents and investments" average balance.
Investment revenue in 2007 increased one percent over 2006 due to wider spreads earned in 2007 and higher average investable balances
in 2007, but were partially offset by higher investment revenue in 2006 that benefited from $14.0 million in cash flows from previously
impaired investments and income from limited partnership interests. During the last half of 2007, our cash investments and adjustable
rate securities, which are primarily tied to LIBOR, earned a wider spread due to the disruption in the credit markets. Investment revenue
in 2006 increased seven
31