MoneyGram 2007 Annual Report Download - page 96
Download and view the complete annual report
Please find page 96 of the 2007 MoneyGram annual report below. You can navigate through the pages in the report by either clicking on the pages listed below, or by using the keyword search tool below to find specific information within the annual report.-
 1
1 -
2
-
3
-
4
-
5
-
6
-
7
-
8
-
9
-
10
-
11
-
12
-
13
-
14
-
15
-
16
-
17
-
18
-
19
-
20
-
21
-
22
-
23
-
24
-
25
-
26
-
27
-
28
-
29
-
30
-
31
-
32
-
33
-
34
-
35
-
36
-
37
-
38
-
39
-
40
-
41
-
42
-
43
-
44
-
45
-
46
-
47
-
48
-
49
-
50
-
51
-
52
-
53
-
54
-
55
-
56
-
57
-
58
-
59
-
60
-
61
-
62
-
63
-
64
-
65
-
66
-
67
-
68
-
69
-
70
-
71
-
72
-
73
-
74
-
75
-
76
-
77
-
78
-
79
-
80
-
81
-
82
-
83
-
84
-
85
-
 86
86 -
 87
87 -
 88
88 -
 89
89 -
 90
90 -
 91
91 -
 92
92 -
 93
93 -
 94
94 -
 95
95 -
 96
96 -
 97
97 -
 98
98 -
 99
99 -
 100
100 -
 101
101 -
 102
102 -
 103
103 -
 104
104 -
 105
105 -
 106
106 -
107
-
108
-
109
-
110
-
111
-
112
-
113
-
114
-
115
-
116
-
117
-
118
-
119
-
120
-
121
-
122
-
123
-
124
-
125
-
126
-
127
-
128
-
129
-
130
-
131
-
132
-
133
-
134
-
135
-
136
-
137
-
138
-
139
-
140
-
141
-
142
-
143
-
144
-
145
-
146
-
147
-
148
-
149
-
150
-
151
-
152
-
153
-
154
-
155
-
156
-
157
-
158
-
159
-
160
-
161
-
162
-
163
-
164
 |
 |

Table of Contents
MONEYGRAM INTERNATIONAL, INC. AND SUBSIDIARIES
NOTES TO CONSOLIDATED FINANCIAL STATEMENTS — (Continued)
U.S. government agencies are included in the AAA rating category. Investment grade is defined as a security having a Moody's
equivalent rating of Aaa, Aa, A or Baa or an S&P or Fitch equivalent rating of AAA, AA, A or BBB.
During the second half of 2007, the rating agencies undertook extensive reviews of the credit ratings of all securities, particularly asset-
backed securities. From September 30, 2007 through December 31, 2007, 123 securities held by the Company were downgraded by one
or more rating agencies, with the majority of the downgrades occurring in November and December 2007. These downgrades primarily
related to securities classified by the Company as "Other asset-backed securities." The actions of the rating agencies also significantly
impacted the collateral securities underlying asset-backed securities held by the Company. From January 1 through March 19, 2008, 66
securities classified by the Company primarily as "Obligations of states and political subdivisions" and "Other asset-backed securities"
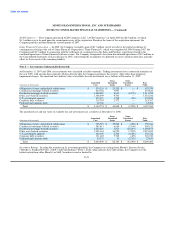
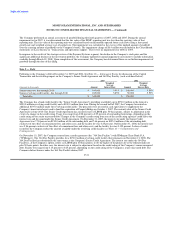
were downgraded. The rating agencies are continuing to review the credit ratings of securities. At December 31, the Company's
investment portfolio consisted of the following ratings:
2007 2006
Number of Fair % of Total Number of Fair % of Total
(Amounts in thousands) Securities Value Portfolio Securities Value Portfolio
AAA, including U.S. agencies 287 $ 2,410,548 58% 324 $ 2,999,500 53%
AA 172 944,804 22% 173 1,233,254 22%
A 134 668,120 16% 141 1,206,583 21%
BBB 11 41,701 1% 10 58,009 1%
Below investment grade 66 122,211 3% 56 193,254 3%
Total 670 $ 4,187,384 100% 704 $ 5,690,600 100%
Had the Company used the lowest rating from either Moody's or S&P in the information presented above, investments rated A or better
would have been reduced by $32.2 million and $15.4 million as of December 31, 2007 and 2006, respectively.
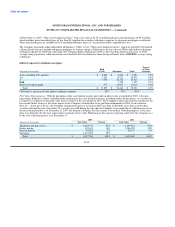
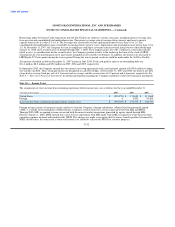
Contractual Maturities: The amortized cost and fair value of available-for-sale securities at December 31, 2007, by contractual maturity,
are shown below. Actual maturities may differ from contractual maturities as borrowers may have the right to call or prepay obligations,
sometimes without call or prepayment penalties. Maturities of mortgage-backed and other asset-backed securities depend on the
repayment characteristics and experience of the underlying obligations.
Amortized Fair
(Amounts in thousands) Cost Value
In one year or less $ 7,645 $ 7,716
After one year through five years 491,066 501,520
After five years through ten years 482,069 497,084
After ten years 182,312 184,280
Mortgage-backed and other asset-backed securities 2,968,914 2,984,016
Preferred and common stock 12,768 12,768
Total $ 4,144,774 $ 4,187,384
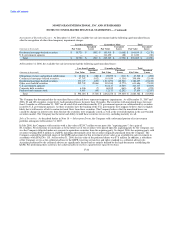
Gains and Losses and Other-Than-Temporary Impairments: At December 31, 2007 and 2006, net unrealized gains of $42.6 million
($26.4 million net of tax) and $39.7 million ($24.6 million net of tax), respectively, are included in the Consolidated Balance Sheets in
"Accumulated other comprehensive loss." During 2007, 2006 and 2005, losses of $737.6 million, $1.7 million and $2.3 million,
respectively, were reclassified from "Accumulated other comprehensive loss" to earnings in connection with the sale of the underlying
securities and other-than-temporary impairments recognized during the year.
F-22