MoneyGram 2007 Annual Report Download - page 113
Download and view the complete annual report
Please find page 113 of the 2007 MoneyGram annual report below. You can navigate through the pages in the report by either clicking on the pages listed below, or by using the keyword search tool below to find specific information within the annual report.-
 1
1 -
2
-
3
-
4
-
5
-
6
-
7
-
8
-
9
-
10
-
11
-
12
-
13
-
14
-
15
-
16
-
17
-
18
-
19
-
20
-
21
-
22
-
23
-
24
-
25
-
26
-
27
-
28
-
29
-
30
-
31
-
32
-
33
-
34
-
35
-
36
-
37
-
38
-
39
-
40
-
41
-
42
-
43
-
44
-
45
-
46
-
47
-
48
-
49
-
50
-
51
-
52
-
53
-
54
-
55
-
56
-
57
-
58
-
59
-
60
-
61
-
62
-
63
-
64
-
65
-
66
-
67
-
68
-
69
-
70
-
71
-
72
-
73
-
74
-
75
-
76
-
77
-
78
-
79
-
80
-
81
-
82
-
83
-
84
-
85
-
86
-
87
-
88
-
89
-
90
-
91
-
92
-
93
-
94
-
95
-
96
-
97
-
98
-
99
-
100
-
101
-
102
-
 103
103 -
 104
104 -
 105
105 -
 106
106 -
 107
107 -
 108
108 -
 109
109 -
 110
110 -
 111
111 -
 112
112 -
 113
113 -
 114
114 -
 115
115 -
 116
116 -
 117
117 -
 118
118 -
 119
119 -
 120
120 -
 121
121 -
 122
122 -
 123
123 -
124
-
125
-
126
-
127
-
128
-
129
-
130
-
131
-
132
-
133
-
134
-
135
-
136
-
137
-
138
-
139
-
140
-
141
-
142
-
143
-
144
-
145
-
146
-
147
-
148
-
149
-
150
-
151
-
152
-
153
-
154
-
155
-
156
-
157
-
158
-
159
-
160
-
161
-
162
-
163
-
164
 |
 |
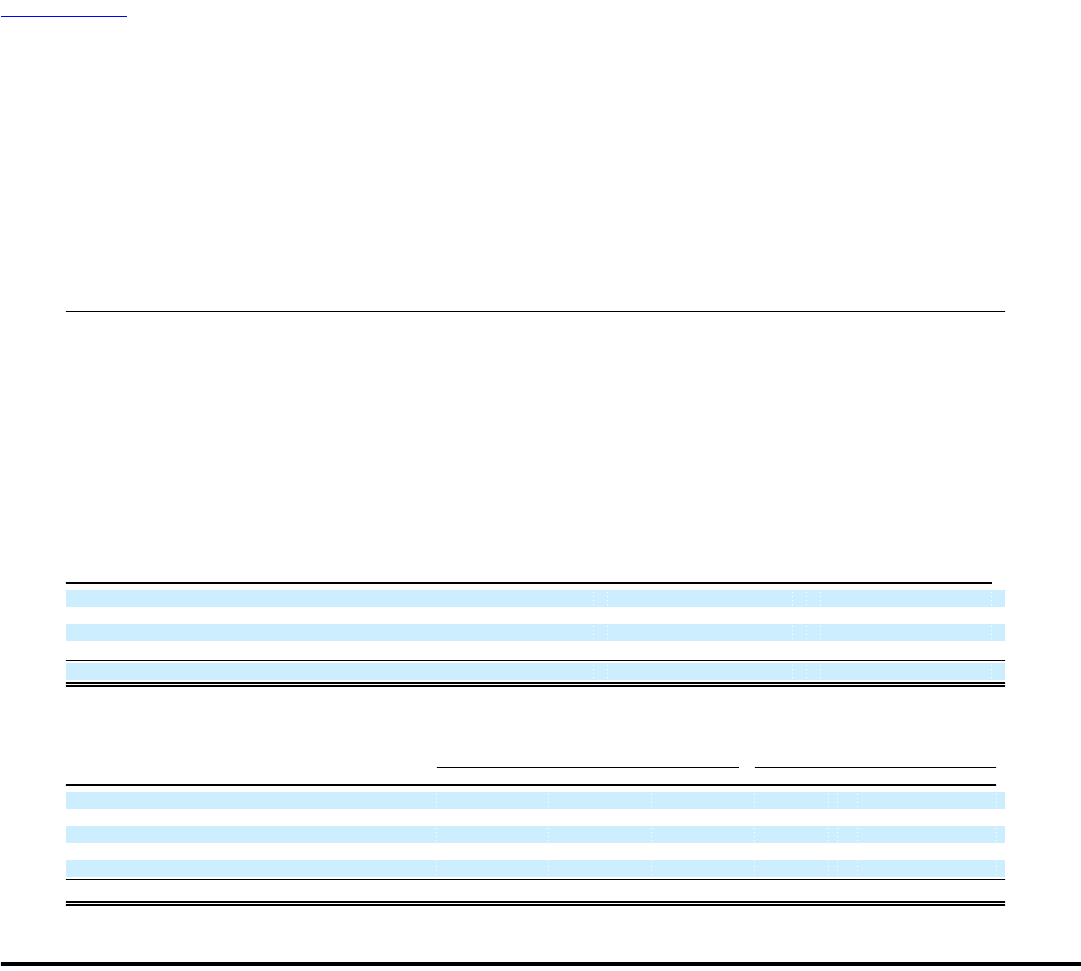
Table of Contents
MONEYGRAM INTERNATIONAL, INC. AND SUBSIDIARIES
NOTES TO CONSOLIDATED FINANCIAL STATEMENTS — (Continued)
evaluated before long-term capital market assumptions are determined. The long-term portfolio return also takes proper consideration of
diversification and rebalancing. Peer data and historical returns are reviewed for reasonableness and appropriateness.
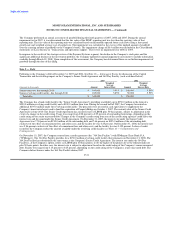
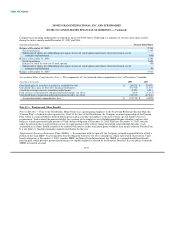
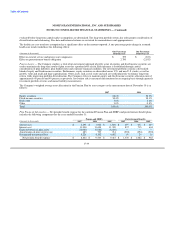
The health care cost trend rate assumption has a significant effect on the amounts reported. A one-percentage point change in assumed
health care trends would have the following effects:
One Percentage One Percentage
(Amounts in thousands) Point Increase Point Decrease
Effect on total of service and interest cost components $ 399 $ (303)
Effect on postretirement benefit obligation 2,700 (2,102)
Pension Assets — The Company employs a total return investment approach whereby a mix of equities and fixed income securities are
used to maximize the long-term return of plan assets for a prudent level of risk. Risk tolerance is established through careful
consideration of plan liabilities, plan funded status and corporate financial condition. The investment portfolio contains a diversified
blend of equity and fixed income securities. Furthermore, equity securities are diversified across U.S. and non-U.S. stocks, as well as
growth, value and small and large capitalizations. Other assets such as real estate and cash are used judiciously to enhance long-term
returns while improving portfolio diversification. The Company strives to maintain equity and fixed income securities allocation mix of
approximately 60 percent and 40 percent, respectively. Investment risk is measured and monitored on an ongoing basis through quarterly
investment portfolio reviews and annual liability measurements.
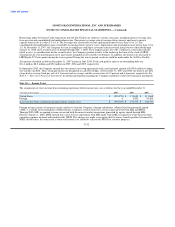
The Company's weighted average asset allocation for the Pension Plan by asset category at the measurement date of November 30 is as
follows:
2007 2006
Equity securities 62.8% 58.5%
Fixed income securities 30.4% 38.1%
Real estate 3.8% 2.6%
Other 3.0% 0.8%
Total 100.0% 100.0%
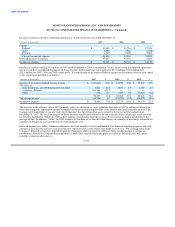
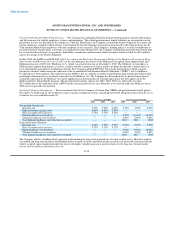
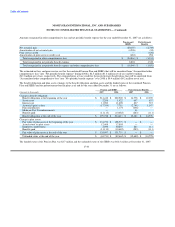
Plan Financial Information — Net periodic benefit expense for the combined Pension Plan and SERPs and postretirement benefit plans
includes the following components for the years ended December 31:
Pension and SERPs Postretirement Benefits
(Amounts in thousands) 2007 2006 2005 2007 2006 2005
Service cost $ 2,298 $ 1,922 $ 1,893 $ 697 $ 637 $ 619
Interest cost 11,900 11,698 11,320 837 715 644
Expected return on plan assets (10,083) (9,082) (8,604) — — —
Amortization of prior service cost 483 703 714 (294) (294) (294)
Recognized net actuarial loss 4,226 4,302 4,092 90 24 16
Net periodic benefit expense $ 8,824 $ 9,543 $ 9,415 $ 1,330 $ 1,082 $ 985
F-39