MoneyGram 2007 Annual Report Download - page 52
Download and view the complete annual report
Please find page 52 of the 2007 MoneyGram annual report below. You can navigate through the pages in the report by either clicking on the pages listed below, or by using the keyword search tool below to find specific information within the annual report.-
 1
1 -
2
-
3
-
4
-
5
-
6
-
7
-
8
-
9
-
10
-
11
-
12
-
13
-
14
-
15
-
16
-
17
-
18
-
19
-
20
-
21
-
22
-
23
-
24
-
25
-
26
-
27
-
28
-
29
-
30
-
31
-
32
-
33
-
34
-
35
-
36
-
37
-
38
-
39
-
40
-
41
-
 42
42 -
 43
43 -
 44
44 -
 45
45 -
 46
46 -
 47
47 -
 48
48 -
 49
49 -
 50
50 -
 51
51 -
 52
52 -
 53
53 -
 54
54 -
 55
55 -
 56
56 -
 57
57 -
 58
58 -
 59
59 -
 60
60 -
 61
61 -
 62
62 -
63
-
64
-
65
-
66
-
67
-
68
-
69
-
70
-
71
-
72
-
73
-
74
-
75
-
76
-
77
-
78
-
79
-
80
-
81
-
82
-
83
-
84
-
85
-
86
-
87
-
88
-
89
-
90
-
91
-
92
-
93
-
94
-
95
-
96
-
97
-
98
-
99
-
100
-
101
-
102
-
103
-
104
-
105
-
106
-
107
-
108
-
109
-
110
-
111
-
112
-
113
-
114
-
115
-
116
-
117
-
118
-
119
-
120
-
121
-
122
-
123
-
124
-
125
-
126
-
127
-
128
-
129
-
130
-
131
-
132
-
133
-
134
-
135
-
136
-
137
-
138
-
139
-
140
-
141
-
142
-
143
-
144
-
145
-
146
-
147
-
148
-
149
-
150
-
151
-
152
-
153
-
154
-
155
-
156
-
157
-
158
-
159
-
160
-
161
-
162
-
163
-
164
 |
 |
Table of Contents
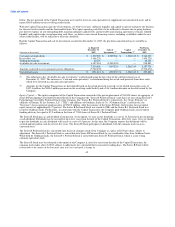
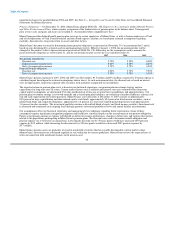
Analysis of Cash Flows
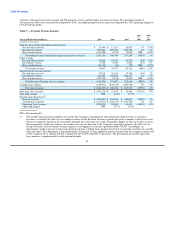
Table 10 — Cash Flows Provided By or Used In Operating Activities
YEAR ENDED DECEMBER 31, 2007 2006 2005
(Amounts in thousands)
Net (loss) income $(1,071,997) $ 124,054 $ 112,946
Total adjustments to reconcile net income 1,301,410 42,485 68,278
Net cash provided by continuing operating activities before changes in payment service assets
and obligations 229,413 166,539 181,224
Change in cash and cash equivalents (substantially restricted) (563,779) (261,725) (84,817)
Change in trading investments, net (substantially restricted) 83,200 22,200 153,100
Change in receivables, net (substantially restricted) 342,681 (335,509) (666,282)
Change in payment service obligations (447,319) 38,489 518,728
Net change in payment service assets and obligations (585,217) (536,545) (79,271)
Net cash (used in) provided by continuing operating activities $ (355,804) $(370,006) $ 101,953
Table 10 summarizes the net cash flows (used in) provided by operating activities. Operating activities used net cash of $355.8 million in
2007, a decrease in cash used of $14.2 million from $370.0 million in 2006. The change in cash used in 2007 is primarily due to
$49.3 million of additional operating cash provided from normal operating activities impacting other assets, accounts payable and other
liabilities. The change also reflects growth in fee and other revenue exceeding the growth in non-cash expenses for the year. These
increases were partially offset by a $48.7 million decrease in the operating cash provided by our payment service assets and obligations
due to normal activities and timing differences. The change from cash provided by operating activities of $102.0 million in 2005 to cash
used by operating activities of $370.0 million in 2006 is primarily due to an increase in cash used for normal operating activities
impacting our payment service assets and obligations and a decrease in cash provided by additional working capital provided from
normal operating activities.
To understand the cash flow activity of our business, the cash provided by (used in) operating activities relating to the payment service
assets and obligations should be reviewed in conjunction with the cash provided by (used in) investing activities related to our investment
portfolio.
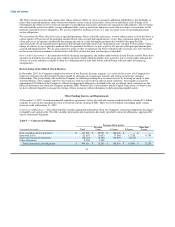
Table 11 — Cash Flows Provided By or Used In Investing Activities
YEAR ENDED DECEMBER 31, 2007 2006 2005
(Amounts in thousands)
Net investment activity $ 318,716 $ 516,008 $ (6,099)
Purchases of property and equipment (70,457) (81,033) (47,359)
Cash paid for acquisitions (29,212) (7,311) (8,535)
Other — — (700)
Net cash provided by (used in) investing activities $ 219,047 $ 427,664 $ (62,693)
Table 11 summarizes the net cash provided by (used in) investing activities. Investing activities primarily consist of activity within our
investment portfolio. The decrease in net investment activity of $197.3 million from 2006 to 2007 reflects lower levels of investment
sales during 2007.
In 2006, we sold securities with a fair value of $259.7 million to one party (the "acquiring party"). No restrictions or constraints as to the
future use of the securities were placed upon the acquiring party by us, nor were we obligated under any scenario to repurchase securities
from the acquiring party. The acquiring party sold securities totaling $646.8 million of a qualifying special purpose entity ("QSPE"),
including substantially all of the securities originally purchased from us. We acquired the preferred shares of the QSPE and accounts for
this investment at fair value as an available-for-sale investment in accordance with Statement of Financial Accounting Standards
49