MoneyGram 2007 Annual Report Download - page 82
Download and view the complete annual report
Please find page 82 of the 2007 MoneyGram annual report below. You can navigate through the pages in the report by either clicking on the pages listed below, or by using the keyword search tool below to find specific information within the annual report.-
 1
1 -
2
-
3
-
4
-
5
-
6
-
7
-
8
-
9
-
10
-
11
-
12
-
13
-
14
-
15
-
16
-
17
-
18
-
19
-
20
-
21
-
22
-
23
-
24
-
25
-
26
-
27
-
28
-
29
-
30
-
31
-
32
-
33
-
34
-
35
-
36
-
37
-
38
-
39
-
40
-
41
-
42
-
43
-
44
-
45
-
46
-
47
-
48
-
49
-
50
-
51
-
52
-
53
-
54
-
55
-
56
-
57
-
58
-
59
-
60
-
61
-
62
-
63
-
64
-
65
-
66
-
67
-
68
-
69
-
70
-
71
-
 72
72 -
 73
73 -
 74
74 -
 75
75 -
 76
76 -
 77
77 -
 78
78 -
 79
79 -
 80
80 -
 81
81 -
 82
82 -
 83
83 -
 84
84 -
 85
85 -
 86
86 -
 87
87 -
 88
88 -
 89
89 -
 90
90 -
 91
91 -
 92
92 -
93
-
94
-
95
-
96
-
97
-
98
-
99
-
100
-
101
-
102
-
103
-
104
-
105
-
106
-
107
-
108
-
109
-
110
-
111
-
112
-
113
-
114
-
115
-
116
-
117
-
118
-
119
-
120
-
121
-
122
-
123
-
124
-
125
-
126
-
127
-
128
-
129
-
130
-
131
-
132
-
133
-
134
-
135
-
136
-
137
-
138
-
139
-
140
-
141
-
142
-
143
-
144
-
145
-
146
-
147
-
148
-
149
-
150
-
151
-
152
-
153
-
154
-
155
-
156
-
157
-
158
-
159
-
160
-
161
-
162
-
163
-
164
 |
 |
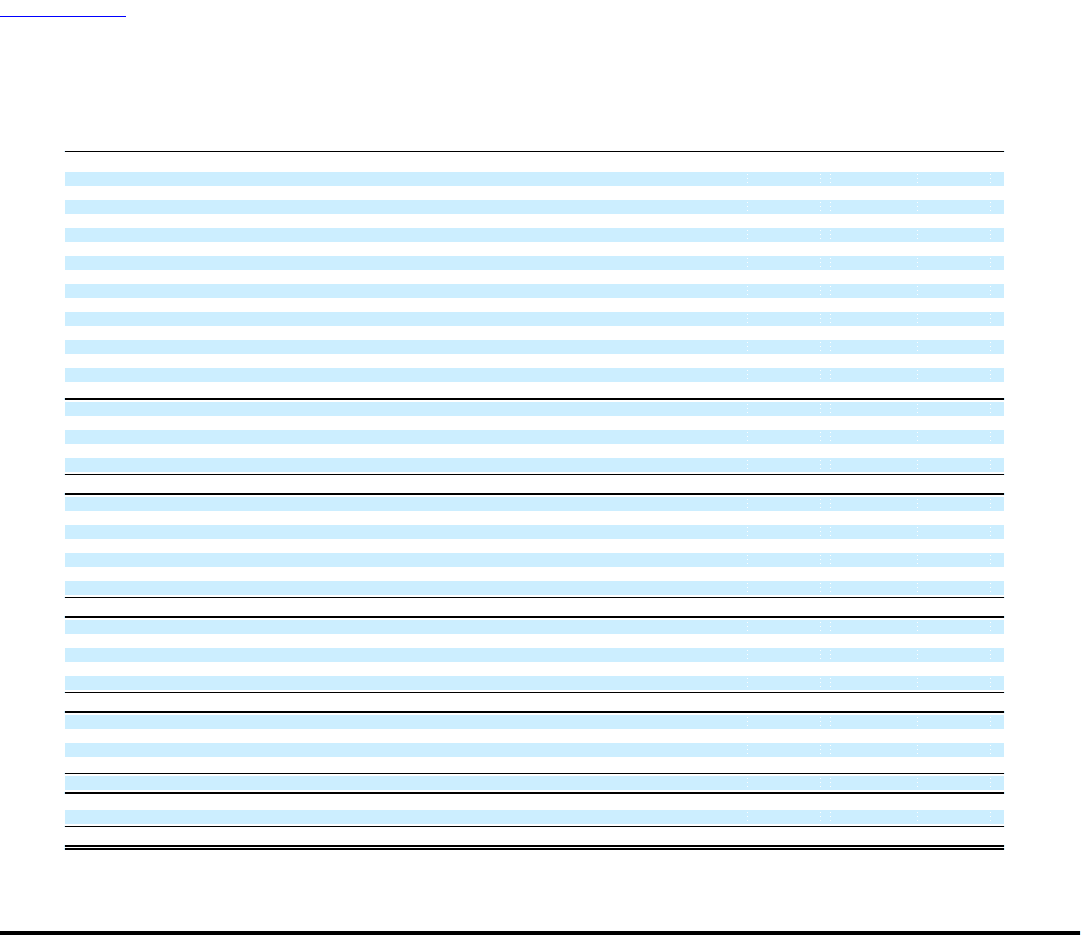
Table of Contents
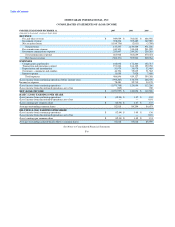
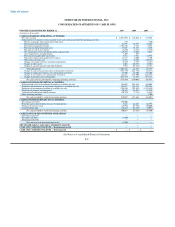
MONEYGRAM INTERNATIONAL, INC.
CONSOLIDATED STATEMENTS OF CASH FLOWS
FOR THE YEAR ENDED DECEMBER 31, 2007 2006 2005
(Amounts in thousands)
CASH FLOWS FROM OPERATING ACTIVITIES:
Net (loss) income $ (1,071,997) $ 124,054 $ 112,946
Adjustments to reconcile net (loss) income to net cash (used in) provided by operating activities:
Net loss (earnings) from discontinued operations 249 — (740)
Depreciation and amortization 51,979 38,978 32,465
Investment impairment charges 1,193,210 5,238 6,552
Provision for deferred income taxes 37,637 33,155 2,880
Net gain on sale of investments (3,649) (2,427) (2,844)
Net amortization of investment premiums and discounts (15,752) (8,208) 7,645
Asset impairments and adjustments 7,205 893 —
Provision for uncollectible receivables 8,532 3,931 12,935
Non-cash compensation and pension expense 14,177 6,600 3,780
Other non-cash items, net (1,881) (3,549) (10,194)
Changes in foreign currency translation adjustments (3,682) 3,795 (4,127)
Change in other assets 5,401 (10,573) (3,201)
Change in accounts payable and other liabilities 7,984 (25,348) 23,127
Total adjustments 1,301,410 42,485 68,278
Change in cash and cash equivalents (substantially restricted) (563,779) (261,725) (84,817)
Change in trading investments, net (substantially restricted) 83,200 22,200 153,100
Change in receivables, net (substantially restricted) 342,681 (335,509) (666,282)
Change in payment service obligations (447,319) 38,489 518,728
Net cash (used in) provided by continuing operating activities (355,804) (370,006) 101,953
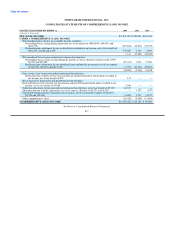
CASH FLOWS FROM INVESTING ACTIVITIES:
Proceeds from sales of investments classified as available-for-sale 321,693 425,236 486,905
Proceeds from maturities of investments classified as available-for-sale 755,921 798,224 978,554
Purchases of investments classified as available-for-sale (758,898) (707,452) (1,471,558)
Purchases of property and equipment (70,457) (81,033) (47,359)
Cash paid for acquisitions and divestitures (29,212) (7,311) (8,535)
Other investing activities — — (700)
Net cash provided by (used in) investing activities 219,047 427,664 (62,693)
CASH FLOWS FROM FINANCING ACTIVITIES:
Net change in revolver 195,000 — —
Proceeds and tax benefit from exercise of stock options 7,674 24,643 16,798
Purchase of treasury stock (45,992) (67,856) (50,000)
Cash dividends paid (16,625) (14,445) (6,058)
Net cash provided by (used in) financing activities 140,057 (57,658) (39,260)
CASH FLOWS OF DISCONTINUED OPERATIONS
Operating cash flows — — —
Investing cash flows (3,300) — —
Financing cash flows — — —
Net cash used in discontinued operations (3,300) — —
NET DECREASE IN CASH AND CASH EQUIVALENTS — — —
CASH AND CASH EQUIVALENTS — Beginning of period — — —
CASH AND CASH EQUIVALENTS — End of period $ — $ — $ —
See Notes to Consolidated Financial Statements
F-8