MoneyGram 2007 Annual Report Download - page 56
Download and view the complete annual report
Please find page 56 of the 2007 MoneyGram annual report below. You can navigate through the pages in the report by either clicking on the pages listed below, or by using the keyword search tool below to find specific information within the annual report.-
 1
1 -
2
-
3
-
4
-
5
-
6
-
7
-
8
-
9
-
10
-
11
-
12
-
13
-
14
-
15
-
16
-
17
-
18
-
19
-
20
-
21
-
22
-
23
-
24
-
25
-
26
-
27
-
28
-
29
-
30
-
31
-
32
-
33
-
34
-
35
-
36
-
37
-
38
-
39
-
40
-
41
-
42
-
43
-
44
-
45
-
 46
46 -
 47
47 -
 48
48 -
 49
49 -
 50
50 -
 51
51 -
 52
52 -
 53
53 -
 54
54 -
 55
55 -
 56
56 -
 57
57 -
 58
58 -
 59
59 -
 60
60 -
 61
61 -
 62
62 -
 63
63 -
 64
64 -
 65
65 -
 66
66 -
67
-
68
-
69
-
70
-
71
-
72
-
73
-
74
-
75
-
76
-
77
-
78
-
79
-
80
-
81
-
82
-
83
-
84
-
85
-
86
-
87
-
88
-
89
-
90
-
91
-
92
-
93
-
94
-
95
-
96
-
97
-
98
-
99
-
100
-
101
-
102
-
103
-
104
-
105
-
106
-
107
-
108
-
109
-
110
-
111
-
112
-
113
-
114
-
115
-
116
-
117
-
118
-
119
-
120
-
121
-
122
-
123
-
124
-
125
-
126
-
127
-
128
-
129
-
130
-
131
-
132
-
133
-
134
-
135
-
136
-
137
-
138
-
139
-
140
-
141
-
142
-
143
-
144
-
145
-
146
-
147
-
148
-
149
-
150
-
151
-
152
-
153
-
154
-
155
-
156
-
157
-
158
-
159
-
160
-
161
-
162
-
163
-
164
 |
 |

Table of Contents
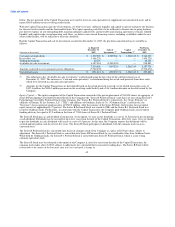
actively monitor the credit risk of our agents by conducting periodic comprehensive financial reviews and cash flow analyses of our
agents who average high volumes of money order sales. In addition, we frequently take additional steps to minimize agent credit risk,
such as requiring owner guarantees, corporate guarantees and other forms of security where appropriate. We monitor remittance patterns
versus reported sales by agent on a daily basis. We also utilize software embedded in each point of sale terminal to control both the
number and dollar amount of money orders sold. This software also allows us to monitor for suspicious transactions or volumes of sales,
assisting in uncovering irregularities such as money laundering, fraud or agent self-use. Finally, we have the ability to remotely disable
money order dispensers or transaction devices to prevent agents from issuing money orders or performing money transfers if suspicious
activity is noted or remittances are not received according to the agent's contract. The point of sale software requires each location to be
re-authorized on a daily basis for transaction processing.
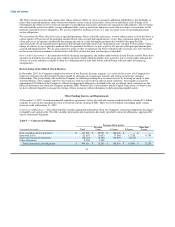
Interest Rate Risk
Interest rate risk represents the potential reduction in net investment revenue as a result of fluctuations in market interest rates. Through
December 31, 2007, fluctuations in interest rates affected the revenue produced by our investment portfolio, the amount of commissions
that we paid to customers in our Payment Systems segment, the net proceeds from our sale of receivables and the amounts that we
received under our interest rate derivatives ("swaps"). As a result, our net investment revenue, which is the difference or "spread"
between the amount we earn on our investment portfolio and the commissions we pay plus the discount on the sale of receivables, net of
the effect of the swaps, was subject to interest rate risk as the components of net investment revenue were not perfectly matched through
time and across all possible interest rate scenarios. Interest rate risk was concentrated in our investment portfolio.
Another component of interest rate risk is market risk that arises from fluctuations in interest rates that may result in changes in the values
of investments and swaps. Stockholders' equity can be adversely affected by changing interest rates, as after-tax changes in the fair value
of securities classified as available for sale investments and after-tax changes in the fair value of swaps are reflected as increases and
decreases to a component of stockholders' equity.
Historically, we have used a wide range of risk measures and analyses to manage the exposure, including on-going business risk
measures and analyses, run-off measures of the existing portfolio and stress test scenarios. The two main evaluators we used were net
income at risk and duration gap. Net income at risk is measured using a static and forecasted portfolio under various interest rate shock
environments. Duration gap is the estimated gap between our assets and liabilities and summarizes the extent that estimated cash flows
are matched over time across various interest rate environments. The third element to our strategy is setting parameters for risk measures
to help attain corporate margin objectives. Management developed actions based upon a number of factors that include both net
investment revenue at risk and duration gap, as well as current market conditions. Internal indicators were used to determine when the
risk profile of our assets should be re-examined. As the risk measures begin to move beyond our internal indicators, we would consider
actions to bring them into the preferred ranges, with an emphasis on time horizon and earnings objectives. We use Value-at-Risk
("VAR") modeling and net investment revenue simulation analysis for measuring and analyzing consolidated interest rate risk.
VAR is a risk assessment methodology that estimates the potential decline in the value of a security or portfolio under various market
conditions. VAR quantifies the change in market value due to changes in volatility and interest rates over a given time horizon, given a
certain level of confidence. We utilize VAR to quantify the potential decline in the fair value of our investment portfolio using a
95 percent confidence level and a one-month time horizon. We use a Monte Carlo model that derives the interest rate change from
volatility assumptions, specified probability and time horizon. The model includes our investment portfolio and interest rate derivative
contracts.
The net investment revenue simulation analysis incorporates substantially all of our interest sensitive assets and liabilities, together with
forecasted changes in the balance sheet and assumptions that reflect the current interest rate environment. This analysis assumes the yield
curve increases gradually over a one-year period.
After the portfolio realignment, our portfolio is invested primarily in cash and cash equivalents and highly liquid short-term investments.
These types of investment have minimal interest rate risk as the yields change with changes in the related interest rate index. We expect
to match these floating rate investment yields with commission expense, which is paid to official check financial institution customers
based on short-term rates, typically the federal funds
53