MoneyGram 2007 Annual Report Download - page 79
Download and view the complete annual report
Please find page 79 of the 2007 MoneyGram annual report below. You can navigate through the pages in the report by either clicking on the pages listed below, or by using the keyword search tool below to find specific information within the annual report.-
 1
1 -
2
-
3
-
4
-
5
-
6
-
7
-
8
-
9
-
10
-
11
-
12
-
13
-
14
-
15
-
16
-
17
-
18
-
19
-
20
-
21
-
22
-
23
-
24
-
25
-
26
-
27
-
28
-
29
-
30
-
31
-
32
-
33
-
34
-
35
-
36
-
37
-
38
-
39
-
40
-
41
-
42
-
43
-
44
-
45
-
46
-
47
-
48
-
49
-
50
-
51
-
52
-
53
-
54
-
55
-
56
-
57
-
58
-
59
-
60
-
61
-
62
-
63
-
64
-
65
-
66
-
67
-
68
-
 69
69 -
 70
70 -
 71
71 -
 72
72 -
 73
73 -
 74
74 -
 75
75 -
 76
76 -
 77
77 -
 78
78 -
 79
79 -
 80
80 -
 81
81 -
 82
82 -
 83
83 -
 84
84 -
 85
85 -
 86
86 -
 87
87 -
 88
88 -
 89
89 -
90
-
91
-
92
-
93
-
94
-
95
-
96
-
97
-
98
-
99
-
100
-
101
-
102
-
103
-
104
-
105
-
106
-
107
-
108
-
109
-
110
-
111
-
112
-
113
-
114
-
115
-
116
-
117
-
118
-
119
-
120
-
121
-
122
-
123
-
124
-
125
-
126
-
127
-
128
-
129
-
130
-
131
-
132
-
133
-
134
-
135
-
136
-
137
-
138
-
139
-
140
-
141
-
142
-
143
-
144
-
145
-
146
-
147
-
148
-
149
-
150
-
151
-
152
-
153
-
154
-
155
-
156
-
157
-
158
-
159
-
160
-
161
-
162
-
163
-
164
 |
 |
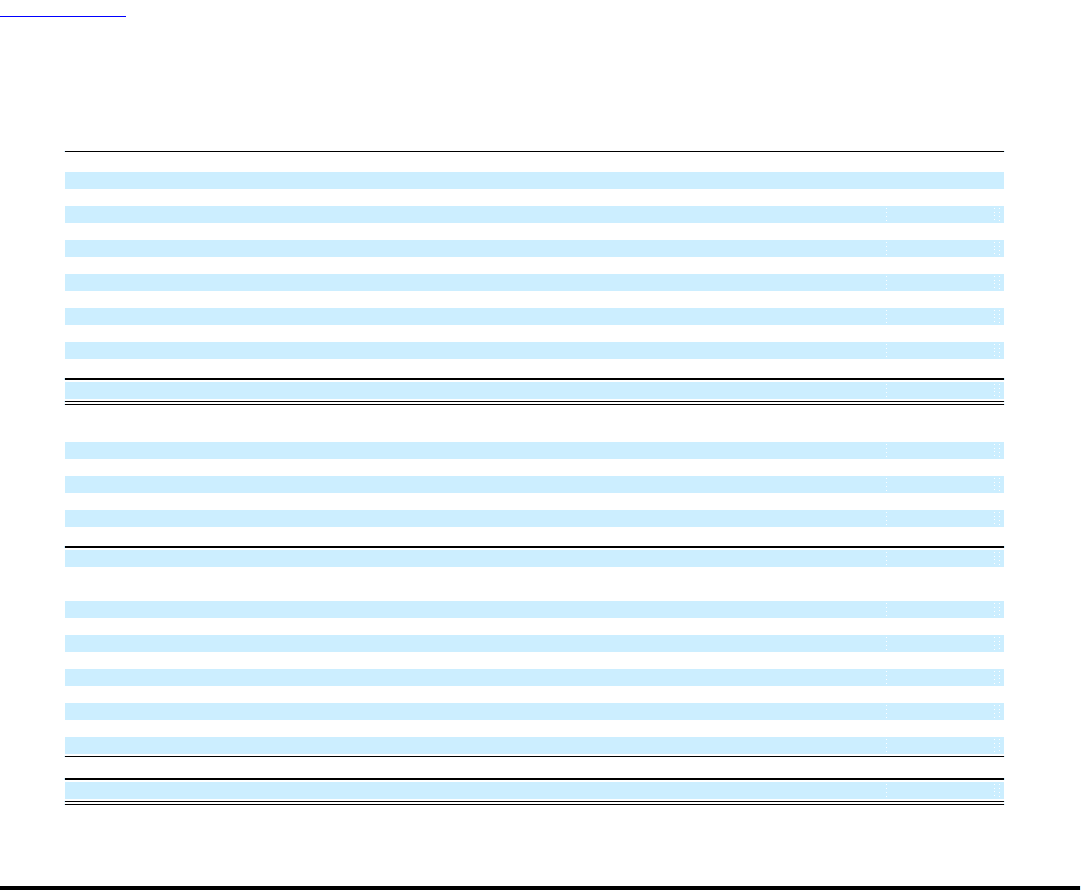
Table of Contents
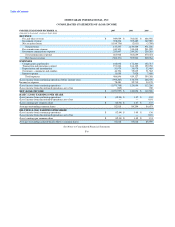
MONEYGRAM INTERNATIONAL, INC.
CONSOLIDATED BALANCE SHEETS
AT DECEMBER 31, 2007 2006
(Amounts in thousands, except share data)
ASSETS
Cash and cash equivalents $ — $ —
Cash and cash equivalents (substantially restricted) 1,552,949 973,931
Receivables, net (substantially restricted) 1,408,220 1,758,682
Trading investments (substantially restricted) 62,105 145,500
Available for sale investments (substantially restricted) 4,187,384 5,690,600
Property and equipment 171,008 148,849
Deferred tax assets — 11,677
Derivative financial instruments 1,647 24,191
Intangible assets 17,605 15,453
Goodwill 438,839 421,316
Other assets 95,254 85,938
Total assets $ 7,935,011 $ 9,276,137
LIABILITIES
Payment service obligations $ 7,762,470 $ 8,209,789
Debt 345,000 150,000
Derivative financial instruments 30,370 3,490
Pension and other postretirement benefits 85,451 103,947
Deferred tax liabilities 11,459 —
Accounts payable and other liabilities 188,778 139,848
Total liabilities 8,423,528 8,607,074
COMMITMENTS AND CONTINGENCIES (Note 14)
STOCKHOLDERS' (DEFICIT) EQUITY
Preferred shares — undesignated, $0.01 par value, 5,000,000 authorized, none issued — —
Preferred shares — junior participating, $0.01 par value, 2,000,000 authorized, none issued — —
Common shares, $0.01 par value, 250,000,000 shares authorized, 88,556,077 shares issued 886 886
Additional paid-in capital 73,077 71,900
Retained (loss) income (387,479) 723,106
Unearned employee benefits (3,280) (17,185)
Accumulated other comprehensive loss (21,715) (6,292)
Treasury stock: 5,910,458 and 4,285,783 shares in 2007 and 2006 (150,006) (103,352)
Total stockholders' (deficit) equity (488,517) 669,063
Total liabilities and stockholders' (deficit) equity $ 7,935,011 $ 9,276,137
See Notes to Consolidated Financial Statements
F-5