MoneyGram 2007 Annual Report Download - page 121
Download and view the complete annual report
Please find page 121 of the 2007 MoneyGram annual report below. You can navigate through the pages in the report by either clicking on the pages listed below, or by using the keyword search tool below to find specific information within the annual report.-
 1
1 -
2
-
3
-
4
-
5
-
6
-
7
-
8
-
9
-
10
-
11
-
12
-
13
-
14
-
15
-
16
-
17
-
18
-
19
-
20
-
21
-
22
-
23
-
24
-
25
-
26
-
27
-
28
-
29
-
30
-
31
-
32
-
33
-
34
-
35
-
36
-
37
-
38
-
39
-
40
-
41
-
42
-
43
-
44
-
45
-
46
-
47
-
48
-
49
-
50
-
51
-
52
-
53
-
54
-
55
-
56
-
57
-
58
-
59
-
60
-
61
-
62
-
63
-
64
-
65
-
66
-
67
-
68
-
69
-
70
-
71
-
72
-
73
-
74
-
75
-
76
-
77
-
78
-
79
-
80
-
81
-
82
-
83
-
84
-
85
-
86
-
87
-
88
-
89
-
90
-
91
-
92
-
93
-
94
-
95
-
96
-
97
-
98
-
99
-
100
-
101
-
102
-
103
-
104
-
105
-
106
-
107
-
108
-
109
-
110
-
 111
111 -
 112
112 -
 113
113 -
 114
114 -
 115
115 -
 116
116 -
 117
117 -
 118
118 -
 119
119 -
 120
120 -
 121
121 -
 122
122 -
 123
123 -
 124
124 -
 125
125 -
 126
126 -
 127
127 -
 128
128 -
 129
129 -
 130
130 -
 131
131 -
132
-
133
-
134
-
135
-
136
-
137
-
138
-
139
-
140
-
141
-
142
-
143
-
144
-
145
-
146
-
147
-
148
-
149
-
150
-
151
-
152
-
153
-
154
-
155
-
156
-
157
-
158
-
159
-
160
-
161
-
162
-
163
-
164
 |
 |

Table of Contents
MONEYGRAM INTERNATIONAL, INC. AND SUBSIDIARIES
NOTES TO CONSOLIDATED FINANCIAL STATEMENTS — (Continued)
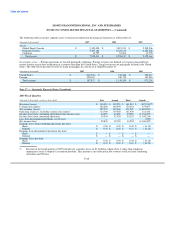
portfolio are allocated to each segment based upon the percentage of that segment's average investable balances to the total average
investable balances.
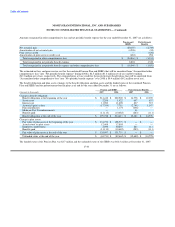
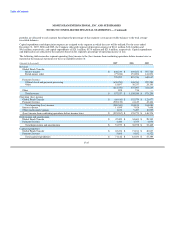
Capital expenditures and depreciation expense are assigned to the segment in which the asset will be utilized. For the years ended
December 31, 2007, 2006 and 2005, the Company allocated corporate depreciation expense of $16.1 million, $12.4 million and
$9.6 million, respectively, and capital expenditures of $25.1 million, $33.6 million and $23.6 million, respectively. Capital expenditures
and depreciation are allocated to the segments based on the segment's percentage of operating income or loss.
The following table reconciles segment operating (loss) income to the (loss) income from continuing operations before income taxes as
reported in the financial statements for the year ended December 31:
(Amounts in thousands) 2007 2006 2005
Revenue
Global Funds Transfer:
Money transfer $ 848,219 $ 669,852 $ 507,726
Retail money order (77,224) 151,894 141,891
770,995 821,746 649,617
Payment Systems:
Official check and payment processing (630,253) 306,760 297,289
Other 15,897 30,337 24,330
(614,356) 337,097 321,619
Other 898 716 —
Total revenue $ 157,537 $ 1,159,559 $ 971,236
Operating (loss) income
Global Funds Transfer $ (60,410) $ 152,579 $ 121,677
Payment Systems (920,130) 41,619 42,406
Total operating (loss) income (980,540) 194,198 164,083
Interest expense 11,055 7,928 7,608
Other unallocated expenses 1,672 9,497 10,099
(Loss) income from continuing operations before income taxes $ (993,267) $ 176,773 $ 146,376
Depreciation and amortization
Global Funds Transfer $ 47,499 $ 34,603 $ 28,395
Payment Systems 4,480 4,375 4,070
Total depreciation and amortization $ 51,979 $ 38,978 $ 32,465
Capital expenditures
Global Funds Transfer $ 65,474 $ 71,181 $ 40,837
Payment Systems 5,668 9,852 6,522
Total capital expenditures $ 71,142 $ 81,033 $ 47,359
F-47