MoneyGram 2007 Annual Report Download - page 80
Download and view the complete annual report
Please find page 80 of the 2007 MoneyGram annual report below. You can navigate through the pages in the report by either clicking on the pages listed below, or by using the keyword search tool below to find specific information within the annual report.-
 1
1 -
2
-
3
-
4
-
5
-
6
-
7
-
8
-
9
-
10
-
11
-
12
-
13
-
14
-
15
-
16
-
17
-
18
-
19
-
20
-
21
-
22
-
23
-
24
-
25
-
26
-
27
-
28
-
29
-
30
-
31
-
32
-
33
-
34
-
35
-
36
-
37
-
38
-
39
-
40
-
41
-
42
-
43
-
44
-
45
-
46
-
47
-
48
-
49
-
50
-
51
-
52
-
53
-
54
-
55
-
56
-
57
-
58
-
59
-
60
-
61
-
62
-
63
-
64
-
65
-
66
-
67
-
68
-
69
-
 70
70 -
 71
71 -
 72
72 -
 73
73 -
 74
74 -
 75
75 -
 76
76 -
 77
77 -
 78
78 -
 79
79 -
 80
80 -
 81
81 -
 82
82 -
 83
83 -
 84
84 -
 85
85 -
 86
86 -
 87
87 -
 88
88 -
 89
89 -
 90
90 -
91
-
92
-
93
-
94
-
95
-
96
-
97
-
98
-
99
-
100
-
101
-
102
-
103
-
104
-
105
-
106
-
107
-
108
-
109
-
110
-
111
-
112
-
113
-
114
-
115
-
116
-
117
-
118
-
119
-
120
-
121
-
122
-
123
-
124
-
125
-
126
-
127
-
128
-
129
-
130
-
131
-
132
-
133
-
134
-
135
-
136
-
137
-
138
-
139
-
140
-
141
-
142
-
143
-
144
-
145
-
146
-
147
-
148
-
149
-
150
-
151
-
152
-
153
-
154
-
155
-
156
-
157
-
158
-
159
-
160
-
161
-
162
-
163
-
164
 |
 |
Table of Contents
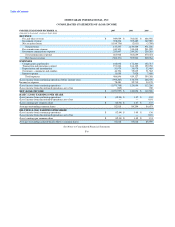
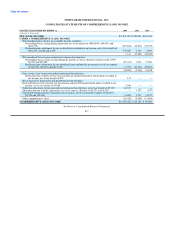
MONEYGRAM INTERNATIONAL, INC.
CONSOLIDATED STATEMENTS OF (LOSS) INCOME
FOR THE YEAR ENDED DECEMBER 31, 2007 2006 2005
(Amounts in thousands, except per share data)
REVENUE
Fee and other revenue $ 949,059 $ 766,881 $ 606,956
Investment revenue 398,234 395,489 367,989
Net securities losses (1,189,756) (2,811) (3,709)
Total revenue 157,537 1,159,559 971,236
Fee commissions expense 410,301 314,418 231,209
Investment commissions expense 253,607 249,241 239,263
Total commissions expense 663,908 563,659 470,472
Net (losses) revenue (506,371) 595,900 500,764
EXPENSES
Compensation and benefits 188,092 172,264 132,715
Transaction and operations support 191,066 164,122 150,038
Depreciation and amortization 51,979 38,978 32,465
Occupancy, equipment and supplies 44,704 35,835 31,562
Interest expense 11,055 7,928 7,608
Total expenses 486,896 419,127 354,388
(Loss) income from continuing operations before income taxes (993,267) 176,773 146,376
Income tax expense 78,481 52,719 34,170
(Loss) income from continuing operations (1,071,748) 124,054 112,206
(Loss) income from discontinued operations, net of tax (249) — 740
NET (LOSS) INCOME $ (1,071,997) $ 124,054 $ 112,946
BASIC (LOSS) EARNINGS PER SHARE
(Loss) income from continuing operations $ (12.94) $ 1.47 $ 1.32
(Loss) income from discontinued operations, net of tax — — 0.01
(Loss) earnings per common share $ (12.94) $ 1.47 $ 1.33
Average outstanding common shares 82,818 84,294 84,675
DILUTED (LOSS) EARNINGS PER SHARE
(Loss) income from continuing operations $ (12.94) $ 1.45 $ 1.30
(Loss) income from discontinued operations, net of tax — — 0.01
(Loss) earnings per common share $ (12.94) $ 1.45 $ 1.31
Average outstanding and potentially dilutive common shares 82,818 85,818 85,970
See Notes to Consolidated Financial Statements
F-6