MoneyGram 2007 Annual Report Download - page 123
Download and view the complete annual report
Please find page 123 of the 2007 MoneyGram annual report below. You can navigate through the pages in the report by either clicking on the pages listed below, or by using the keyword search tool below to find specific information within the annual report.-
 1
1 -
2
-
3
-
4
-
5
-
6
-
7
-
8
-
9
-
10
-
11
-
12
-
13
-
14
-
15
-
16
-
17
-
18
-
19
-
20
-
21
-
22
-
23
-
24
-
25
-
26
-
27
-
28
-
29
-
30
-
31
-
32
-
33
-
34
-
35
-
36
-
37
-
38
-
39
-
40
-
41
-
42
-
43
-
44
-
45
-
46
-
47
-
48
-
49
-
50
-
51
-
52
-
53
-
54
-
55
-
56
-
57
-
58
-
59
-
60
-
61
-
62
-
63
-
64
-
65
-
66
-
67
-
68
-
69
-
70
-
71
-
72
-
73
-
74
-
75
-
76
-
77
-
78
-
79
-
80
-
81
-
82
-
83
-
84
-
85
-
86
-
87
-
88
-
89
-
90
-
91
-
92
-
93
-
94
-
95
-
96
-
97
-
98
-
99
-
100
-
101
-
102
-
103
-
104
-
105
-
106
-
107
-
108
-
109
-
110
-
111
-
112
-
 113
113 -
 114
114 -
 115
115 -
 116
116 -
 117
117 -
 118
118 -
 119
119 -
 120
120 -
 121
121 -
 122
122 -
 123
123 -
 124
124 -
 125
125 -
 126
126 -
 127
127 -
 128
128 -
 129
129 -
 130
130 -
 131
131 -
 132
132 -
 133
133 -
134
-
135
-
136
-
137
-
138
-
139
-
140
-
141
-
142
-
143
-
144
-
145
-
146
-
147
-
148
-
149
-
150
-
151
-
152
-
153
-
154
-
155
-
156
-
157
-
158
-
159
-
160
-
161
-
162
-
163
-
164
 |
 |

Table of Contents
MONEYGRAM INTERNATIONAL, INC. AND SUBSIDIARIES
NOTES TO CONSOLIDATED FINANCIAL STATEMENTS — (Continued)
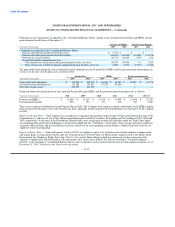
2006 Fiscal Quarters
(Amounts in thousands, except per share data) First Second Third Fourth
Revenues $ 263,672 $ 292,913 $ 296,431 $ 306,543
Commission expense 126,273 138,655 146,664 152,067
Net revenues 137,399 154,258 149,767 154,476
Operating expenses, excluding commission expense 91,711 102,440 107,807 117,169
Income from operations before income taxes 45,688 51,818 41,960 37,307
Net income from continuing operations 30,935 36,706 30,038 26,375
Earnings from continuing operations per share
Basic $ 0.37 $ 0.43 $ 0.36 $ 0.31
Diluted 0.36 0.42 0.35 0.31
Earnings from discontinued operations per share
Basic $ — $ — $ — $ —
Diluted — — — —
Earnings per share
Basic $ 0.37 $ 0.43 $ 0.36 $ 0.31
Diluted 0.36 0.42 0.35 0.31
The summation of quarterly earnings per share may not equate to the calculation for the full year as quarterly calculations are performed
on a discrete basis.
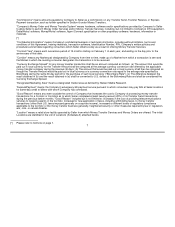
Note 18 — Subsequent Events
Sale of Investments: As described in Note 4 — Investments (Substantially Restricted), the Company commenced a plan in January 2008
to realign its investment portfolio away from asset-backed securities and into highly liquid assets through the sale of a substantial portion
of the available-for-sale investment portfolio. Through March 7, 2008, the Company sold investments with a combined fair value at
December 31, 2007 of $3.2 billion (after other-than-temporary impairment charges) for proceeds of approximately $2.9 billion and a
realized loss of $260.6 million. As the Company recognized an other-than-temporary impairment charge as of December 31, 2007 for all
investments which were sold, the realized losses resulting from the sale of investments were the result of further market deterioration in
2008 and the short time-frame over which the Company sold the investments. The realized losses will be recognized in the first quarter of
2008. The proceeds from the sale of investments will be invested in cash equivalents.
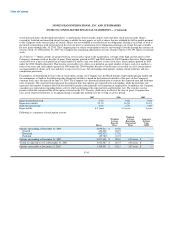
Following is pro forma financial data representing the composition of the available-for-sale investment portfolio as if the sale of the
investments had occurred as of December 31, 2007:
Fair Value Pro Forma
As Reported Fair Value
December 31, Sales of December 31,
(Amounts in thousands) 2007 Investments (1) 2007
Obligations of states and political subdivisions $ 597,379 (597,379) $ —
Commercial mortgage-backed securities 253,823 (253,823) —
Residential mortgage-backed securities 1,411,952 (949,284) 462,668
Other asset-backed securities 1,318,242 (1,216,882) 101,360
U.S. government agencies 374,853 — 374,853
Corporate debt securities 218,367 (218,367) —
Preferred and common stock 12,768 (12,768) —
Total available-for-sale investments $ 4,187,384 $ (3,248,503) $ 938,881
(1) Fair value as of December 31, 2007 of the investments sold during the first quarter of 2008.
F-49