Kraft 2009 Annual Report Download - page 90
Download and view the complete annual report
Please find page 90 of the 2009 Kraft annual report below. You can navigate through the pages in the report by either clicking on the pages listed below, or by using the keyword search tool below to find specific information within the annual report.-
 1
1 -
2
-
3
-
4
-
5
-
6
-
7
-
8
-
9
-
10
-
11
-
12
-
13
-
14
-
15
-
16
-
17
-
18
-
19
-
20
-
21
-
22
-
23
-
24
-
25
-
26
-
27
-
28
-
29
-
30
-
31
-
32
-
33
-
34
-
35
-
36
-
37
-
38
-
39
-
40
-
41
-
42
-
43
-
44
-
45
-
46
-
47
-
48
-
49
-
50
-
51
-
52
-
53
-
54
-
55
-
56
-
57
-
58
-
59
-
60
-
61
-
62
-
63
-
64
-
65
-
66
-
67
-
68
-
69
-
70
-
71
-
72
-
73
-
74
-
75
-
76
-
77
-
78
-
79
-
 80
80 -
 81
81 -
 82
82 -
 83
83 -
 84
84 -
 85
85 -
 86
86 -
 87
87 -
 88
88 -
 89
89 -
 90
90 -
 91
91 -
 92
92 -
 93
93 -
 94
94 -
 95
95 -
 96
96 -
 97
97 -
 98
98 -
 99
99 -
 100
100 -
101
-
102
-
103
-
104
-
105
-
106
-
107
-
108
-
109
-
110
-
111
-
112
-
113
-
114
-
115
-
116
-
117
-
118
-
119
-
120
-
121
-
122
-
123
-
124
-
125
-
126
-
127
-
128
-
129
-
130
-
131
-
132
-
133
-
134
-
135
-
136
-
137
-
138
-
139
-
140
-
141
-
142
-
143
-
144
-
145
-
146
-
147
-
148
-
149
-
150
-
151
-
152
-
153
-
154
-
155
-
156
-
157
-
158
-
159
-
160
-
161
-
162
-
163
-
164
-
165
-
166
-
167
-
168
-
169
-
170
-
171
-
172
-
173
-
174
-
175
-
176
-
177
-
178
-
179
-
180
-
181
-
182
-
183
-
184
-
185
-
186
-
187
-
188
-
189
-
190
-
191
-
192
-
193
-
194
-
195
-
196
-
197
-
198
-
199
-
200
-
201
-
202
-
203
-
204
-
205
-
206
-
207
-
208
-
209
-
210
-
211
-
212
-
213
-
214
-
215
-
216
-
217
-
218
-
219
-
220
-
221
-
222
-
223
-
224
-
225
-
226
-
227
-
228
-
229
-
230
-
231
-
232
-
233
-
234
-
235
-
236
-
237
-
238
-
239
-
240
-
241
-
242
-
243
 |
 |

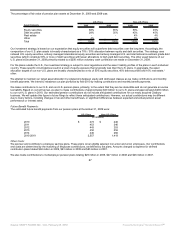
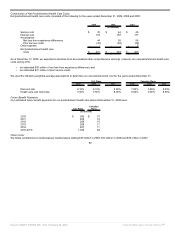
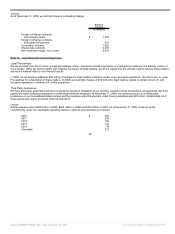
The percentage of fair value of pension plan assets at December 31, 2009 and 2008 was:
U.S. Plans Non-U.S. Plans
Asset Category 2009 2008 2009 2008
Equity securities 68% 65% 50% 45%
Debt securities 28% 35% 43% 45%
Real estate - - 4% 4%
Other 4% - 3% 6%
Total 100% 100% 100% 100%
Our investment strategy is based on our expectation that equity securities will outperform debt securities over the long term. Accordingly, the
composition of our U.S. plan assets is broadly characterized as a 70% / 30% allocation between equity and debt securities. The strategy uses
indexed U.S. equity securities, actively managed international equity securities and actively managed U.S. and international investment grade debt
securities (which constitute 90% or more of debt securities) with lesser allocations to high yield debt securities. The other asset balance of our
U.S. plans at December 31, 2009 primarily related to a $200 million voluntary cash contribution we made on December 31, 2009.
For the plans outside the U.S., the investment strategy is subject to local regulations and the asset / liability profiles of the plans in each individual
country. These specific circumstances result in a level of equity exposure that is typically less than the U.S. plans. In aggregate, the asset
allocation targets of our non-U.S. plans are broadly characterized as a mix of 50% equity securities, 40% debt securities and 10% real estate /
other.
We attempt to maintain our target asset allocation by rebalancing between equity and debt asset classes as we make contributions and monthly
benefit payments. We intend to rebalance our plan portfolios by mid-2010 by making contributions and monthly benefit payments.
We make contributions to our U.S. and non-U.S. pension plans, primarily, to the extent that they are tax deductible and do not generate an excise
tax liability. Based on current tax law, we plan to make contributions of approximately $40 million to our U.S. plans and approximately $200 million
to our non-U.S. plans in 2010. Our estimated pension contributions do not include anticipated contributions for our newly acquired Cadbury
business. We will update this figure in future filings to reflect these anticipated contributions. However, our actual contributions may be different
due to many factors, including changes in tax and other benefit laws, or significant differences between expected and actual pension asset
performance or interest rates.
Future Benefit Payments:
The estimated future benefit payments from our pension plans at December 31, 2009 were:
U.S. Plans Non-U.S. Plans
(in millions)
2010 $ 473 $ 246
2011 453 246
2012 443 253
2013 450 256
2014 440 260
2015-2019 2,557 1,419
Other Costs:
We sponsor and contribute to employee savings plans. These plans cover eligible salaried, non-union and union employees. Our contributions
and costs are determined by the matching of employee contributions, as defined by the plans. Amounts charged to expense for defined
contribution plans totaled $94 million in 2009, $93 million in 2008 and $83 million in 2007.
We also made contributions to multiemployer pension plans totaling $29 million in 2009, $27 million in 2008 and $26 million in 2007.
87
Source: KRAFT FOODS INC, 10-K, February 25, 2010 Powered by Morningstar® Document Research℠