Kraft 2009 Annual Report Download - page 63
Download and view the complete annual report
Please find page 63 of the 2009 Kraft annual report below. You can navigate through the pages in the report by either clicking on the pages listed below, or by using the keyword search tool below to find specific information within the annual report.-
 1
1 -
2
-
3
-
4
-
5
-
6
-
7
-
8
-
9
-
10
-
11
-
12
-
13
-
14
-
15
-
16
-
17
-
18
-
19
-
20
-
21
-
22
-
23
-
24
-
25
-
26
-
27
-
28
-
29
-
30
-
31
-
32
-
33
-
34
-
35
-
36
-
37
-
38
-
39
-
40
-
41
-
42
-
43
-
44
-
45
-
46
-
47
-
48
-
49
-
50
-
51
-
52
-
 53
53 -
 54
54 -
 55
55 -
 56
56 -
 57
57 -
 58
58 -
 59
59 -
 60
60 -
 61
61 -
 62
62 -
 63
63 -
 64
64 -
 65
65 -
 66
66 -
 67
67 -
 68
68 -
 69
69 -
 70
70 -
 71
71 -
 72
72 -
 73
73 -
74
-
75
-
76
-
77
-
78
-
79
-
80
-
81
-
82
-
83
-
84
-
85
-
86
-
87
-
88
-
89
-
90
-
91
-
92
-
93
-
94
-
95
-
96
-
97
-
98
-
99
-
100
-
101
-
102
-
103
-
104
-
105
-
106
-
107
-
108
-
109
-
110
-
111
-
112
-
113
-
114
-
115
-
116
-
117
-
118
-
119
-
120
-
121
-
122
-
123
-
124
-
125
-
126
-
127
-
128
-
129
-
130
-
131
-
132
-
133
-
134
-
135
-
136
-
137
-
138
-
139
-
140
-
141
-
142
-
143
-
144
-
145
-
146
-
147
-
148
-
149
-
150
-
151
-
152
-
153
-
154
-
155
-
156
-
157
-
158
-
159
-
160
-
161
-
162
-
163
-
164
-
165
-
166
-
167
-
168
-
169
-
170
-
171
-
172
-
173
-
174
-
175
-
176
-
177
-
178
-
179
-
180
-
181
-
182
-
183
-
184
-
185
-
186
-
187
-
188
-
189
-
190
-
191
-
192
-
193
-
194
-
195
-
196
-
197
-
198
-
199
-
200
-
201
-
202
-
203
-
204
-
205
-
206
-
207
-
208
-
209
-
210
-
211
-
212
-
213
-
214
-
215
-
216
-
217
-
218
-
219
-
220
-
221
-
222
-
223
-
224
-
225
-
226
-
227
-
228
-
229
-
230
-
231
-
232
-
233
-
234
-
235
-
236
-
237
-
238
-
239
-
240
-
241
-
242
-
243
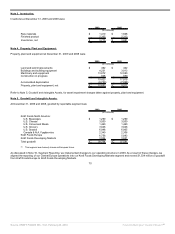
 |
 |

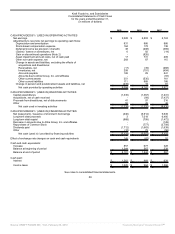
Cash and Cash Equivalents:
Cash equivalents include demand deposits with banks and all highly liquid investments with original maturities of three months or less.
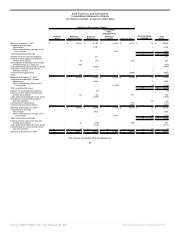
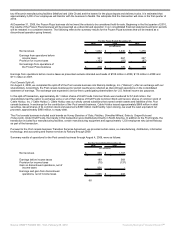
Inventories:
Inventories are stated at the lower of cost or market. We record inventory allowances for overstocked and obsolete inventories due to ingredient
and packaging changes. Effective January 1, 2009, we changed our method of valuing our U.S. inventories to the average cost method. In prior
years, principally all U.S. inventories were valued using the last-in, first-out (“LIFO”) method. We believe that the average cost method of
accounting for U.S. inventories is preferable and will improve financial reporting by better matching revenues and expenses to current costs, by
better aligning our external reporting with our competitors, and by aligning our external reporting with our tax basis of accounting. The financial
statements for all periods presented were conformed to the change in accounting policy. With this change, we value all of our inventories using the
average cost method.
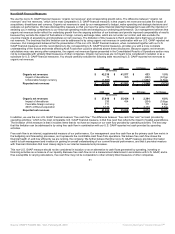
The following line items within the statements of earnings were affected by the change in accounting policy:
For the Year Ended December 31, 2009
As Computed
under LIFO
As Reported under
Average Cost
Favorable /
(Unfavorable)
(in millions, except per share data)
Cost of sales $ 25,691 $ 25,786 $ (95)
Provision for income taxes 1,294 1,259 35
Earnings from continuing operations 3,088 3,028 (60)
Earnings and gain from discontinued
operations, net of income taxes - - -
Net earnings attributable to Kraft Foods 3,081 3,021 (60)
Basic earnings per share attributable
to Kraft Foods:
Continuing operations $ 2.08 $ 2.04 $ (0.04)
Discontinued operations - - -
Net earnings attributable to Kraft Foods $ 2.08 $ 2.04 $ (0.04)
Diluted earnings per share attributable
to Kraft Foods:
Continuing operations $ 2.07 $ 2.03 $ (0.04)
Discontinued operations - - -
Net earnings attributable to Kraft Foods $ 2.07 $ 2.03 $ (0.04)
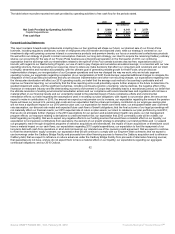
For the Year Ended December 31, 2008
As Computed
under LIFO
As Reported under
Average Cost
Favorable /
(Unfavorable)
(in millions, except per share data)
Cost of sales $ 28,105 $ 28,088 $ 17
Provision for income taxes 728 755 (27)
Earnings from continuing operations 1,858 1,848 (10)
Earnings and gain from discontinued
operations, net of income taxes 1,052 1,045 (7)
Net earnings attributable to Kraft Foods 2,901 2,884 (17)
Basic earnings per share attributable
to Kraft Foods:
Continuing operations $ 1.23 $ 1.22 $ (0.01)
Discontinued operations 0.70 0.70 -
Net earnings attributable to Kraft Foods $ 1.93 $ 1.92 $ (0.01)
Diluted earnings per share attributable
to Kraft Foods:
Continuing operations $ 1.22 $ 1.21 $ (0.01)
Discontinued operations 0.69 0.69 -
Net earnings attributable to Kraft Foods $ 1.91 $ 1.90 $ (0.01)
60
Source: KRAFT FOODS INC, 10-K, February 25, 2010 Powered by Morningstar® Document Research℠