Kraft 2009 Annual Report Download - page 64
Download and view the complete annual report
Please find page 64 of the 2009 Kraft annual report below. You can navigate through the pages in the report by either clicking on the pages listed below, or by using the keyword search tool below to find specific information within the annual report.-
 1
1 -
2
-
3
-
4
-
5
-
6
-
7
-
8
-
9
-
10
-
11
-
12
-
13
-
14
-
15
-
16
-
17
-
18
-
19
-
20
-
21
-
22
-
23
-
24
-
25
-
26
-
27
-
28
-
29
-
30
-
31
-
32
-
33
-
34
-
35
-
36
-
37
-
38
-
39
-
40
-
41
-
42
-
43
-
44
-
45
-
46
-
47
-
48
-
49
-
50
-
51
-
52
-
53
-
 54
54 -
 55
55 -
 56
56 -
 57
57 -
 58
58 -
 59
59 -
 60
60 -
 61
61 -
 62
62 -
 63
63 -
 64
64 -
 65
65 -
 66
66 -
 67
67 -
 68
68 -
 69
69 -
 70
70 -
 71
71 -
 72
72 -
 73
73 -
 74
74 -
75
-
76
-
77
-
78
-
79
-
80
-
81
-
82
-
83
-
84
-
85
-
86
-
87
-
88
-
89
-
90
-
91
-
92
-
93
-
94
-
95
-
96
-
97
-
98
-
99
-
100
-
101
-
102
-
103
-
104
-
105
-
106
-
107
-
108
-
109
-
110
-
111
-
112
-
113
-
114
-
115
-
116
-
117
-
118
-
119
-
120
-
121
-
122
-
123
-
124
-
125
-
126
-
127
-
128
-
129
-
130
-
131
-
132
-
133
-
134
-
135
-
136
-
137
-
138
-
139
-
140
-
141
-
142
-
143
-
144
-
145
-
146
-
147
-
148
-
149
-
150
-
151
-
152
-
153
-
154
-
155
-
156
-
157
-
158
-
159
-
160
-
161
-
162
-
163
-
164
-
165
-
166
-
167
-
168
-
169
-
170
-
171
-
172
-
173
-
174
-
175
-
176
-
177
-
178
-
179
-
180
-
181
-
182
-
183
-
184
-
185
-
186
-
187
-
188
-
189
-
190
-
191
-
192
-
193
-
194
-
195
-
196
-
197
-
198
-
199
-
200
-
201
-
202
-
203
-
204
-
205
-
206
-
207
-
208
-
209
-
210
-
211
-
212
-
213
-
214
-
215
-
216
-
217
-
218
-
219
-
220
-
221
-
222
-
223
-
224
-
225
-
226
-
227
-
228
-
229
-
230
-
231
-
232
-
233
-
234
-
235
-
236
-
237
-
238
-
239
-
240
-
241
-
242
-
243
 |
 |

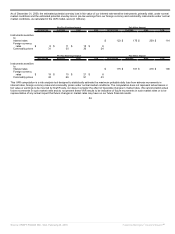
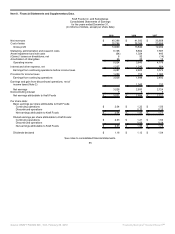
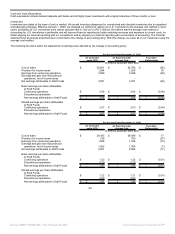
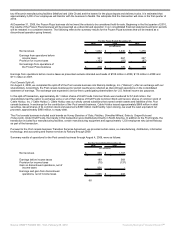
For the Year Ended December 31, 2007
As Computed
under LIFO
As Reported under
Average Cost
Favorable /
(Unfavorable)
(in millions, except per share data)
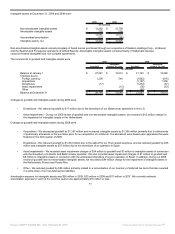
Cost of sales $ 23,864 $ 23,656 $ 208
Gains on divestitures, net 15 14 (1)
Provision for income taxes 1,002 1,080 (78)
Earnings from continuing operations 2,363 2,492 129
Earnings and gain from discontinued
operations, net of income taxes 230 232 2
Net earnings attributable to Kraft Foods 2,590 2,721 131
Basic earnings per share attributable
to Kraft Foods:
Continuing operations $ 1.48 $ 1.56 $ 0.08
Discontinued operations 0.15 0.15 -
Net earnings attributable to Kraft Foods $ 1.63 $ 1.71 $ 0.08
Diluted earnings per share attributable
to Kraft Foods:
Continuing operations $ 1.48 $ 1.56 $ 0.08
Discontinued operations 0.14 0.14 -
Net earnings attributable to Kraft Foods $ 1.62 $ 1.70 $ 0.08
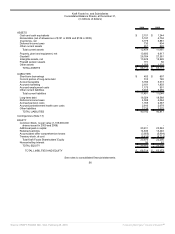
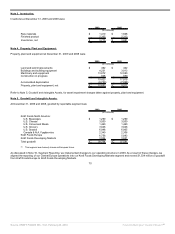
The following line items within the balance sheets were affected by the change in accounting policy:
December 31, 2009
As Computed
under LIFO
As Reported under
Average Cost
Favorable /
(Unfavorable)
(in millions)
Inventories, net $ 3,718 $ 3,775 $ (57)
Deferred income tax asset 752 730 22
Retained earnings 14,601 14,636 35
December 31, 2008
As Computed
under LIFO
As Reported under
Average Cost
Favorable /
(Unfavorable)
(in millions)
Inventories, net $ 3,729 $ 3,881 $ (152)
Deferred income tax asset 861 804 57
Retained earnings 13,345 13,440 95
As a result of the accounting change, retained earnings as of January 1, 2007, decreased from $11,128 million, as computed using the LIFO
method, to $11,109 million using the average cost method.
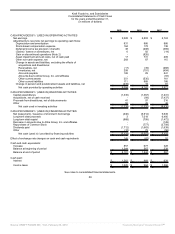
There was no impact to net cash provided by operating activities as a result of this change in accounting policy.
Long-Lived Assets:
Property, plant and equipment are stated at historical cost and depreciated by the straight-line method over the estimated useful lives of the
assets. Machinery and equipment are depreciated over periods ranging from 3 to 20 years and buildings and building improvements over periods
up to 40 years.
We review long-lived assets, including amortizable intangible assets, for impairment when conditions exist that indicate the carrying amount of the
assets may not be fully recoverable. We perform undiscounted operating cash flow analyses to determine if an impairment exists. When testing
assets held for use for impairment, we group assets and liabilities at the lowest level for which cash flows are separately identifiable. If an
impairment is determined to exist, the loss is calculated based on estimated fair value. Impairment losses on assets to be disposed of, if any, are
based on the estimated proceeds to be received, less costs of disposal.
61
Source: KRAFT FOODS INC, 10-K, February 25, 2010 Powered by Morningstar® Document Research℠