Kraft 2009 Annual Report Download - page 20
Download and view the complete annual report
Please find page 20 of the 2009 Kraft annual report below. You can navigate through the pages in the report by either clicking on the pages listed below, or by using the keyword search tool below to find specific information within the annual report.-
 1
1 -
2
-
3
-
4
-
5
-
6
-
7
-
8
-
9
-
 10
10 -
 11
11 -
 12
12 -
 13
13 -
 14
14 -
 15
15 -
 16
16 -
 17
17 -
 18
18 -
 19
19 -
 20
20 -
 21
21 -
 22
22 -
 23
23 -
 24
24 -
 25
25 -
 26
26 -
 27
27 -
 28
28 -
 29
29 -
 30
30 -
31
-
32
-
33
-
34
-
35
-
36
-
37
-
38
-
39
-
40
-
41
-
42
-
43
-
44
-
45
-
46
-
47
-
48
-
49
-
50
-
51
-
52
-
53
-
54
-
55
-
56
-
57
-
58
-
59
-
60
-
61
-
62
-
63
-
64
-
65
-
66
-
67
-
68
-
69
-
70
-
71
-
72
-
73
-
74
-
75
-
76
-
77
-
78
-
79
-
80
-
81
-
82
-
83
-
84
-
85
-
86
-
87
-
88
-
89
-
90
-
91
-
92
-
93
-
94
-
95
-
96
-
97
-
98
-
99
-
100
-
101
-
102
-
103
-
104
-
105
-
106
-
107
-
108
-
109
-
110
-
111
-
112
-
113
-
114
-
115
-
116
-
117
-
118
-
119
-
120
-
121
-
122
-
123
-
124
-
125
-
126
-
127
-
128
-
129
-
130
-
131
-
132
-
133
-
134
-
135
-
136
-
137
-
138
-
139
-
140
-
141
-
142
-
143
-
144
-
145
-
146
-
147
-
148
-
149
-
150
-
151
-
152
-
153
-
154
-
155
-
156
-
157
-
158
-
159
-
160
-
161
-
162
-
163
-
164
-
165
-
166
-
167
-
168
-
169
-
170
-
171
-
172
-
173
-
174
-
175
-
176
-
177
-
178
-
179
-
180
-
181
-
182
-
183
-
184
-
185
-
186
-
187
-
188
-
189
-
190
-
191
-
192
-
193
-
194
-
195
-
196
-
197
-
198
-
199
-
200
-
201
-
202
-
203
-
204
-
205
-
206
-
207
-
208
-
209
-
210
-
211
-
212
-
213
-
214
-
215
-
216
-
217
-
218
-
219
-
220
-
221
-
222
-
223
-
224
-
225
-
226
-
227
-
228
-
229
-
230
-
231
-
232
-
233
-
234
-
235
-
236
-
237
-
238
-
239
-
240
-
241
-
242
-
243
 |
 |

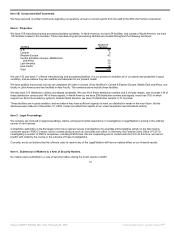
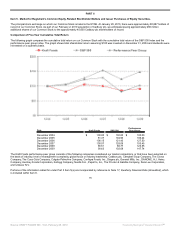
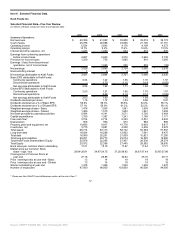
Item 6. Selected Financial Data.
Kraft Foods Inc.
Selected Financial Data—Five Year Review
(in millions of dollars, except per share and employee data)
2009 2008 2007 2006 2005
Summary of Operations:
Net revenues $ 40,386 $ 41,932 $ 35,858 $ 33,018 $ 32,779
Cost of sales 25,786 28,088 23,656 21,190 21,115
Operating income 5,524 3,843 4,176 4,158 4,373
Operating margin 13.7% 9.2% 11.6% 12.6% 13.3%
Interest and other expense, net 1,237 1,240 604 510 635
Earnings from continuing operations
before income taxes 4,287 2,603 3,572 3,648 3,738
Provision for income taxes 1,259 755 1,080 816 1,066
Earnings / (loss) from discontinued
operations, net of income taxes - 1,045 232 233 (33)
Net earnings 3,028 2,893 2,724 3,065 2,639
Noncontrolling interest 7 9 3 5 3
Net earnings attributable to Kraft Foods 3,021 2,884 2,721 3,060 2,636
Basic EPS attributable to Kraft Foods:
Continuing operations 2.04 1.22 1.56 1.70 1.57
Discontinued operations - 0.70 0.15 0.14 (0.02)
Net earnings attributable to Kraft Foods 2.04 1.92 1.71 1.84 1.55
Diluted EPS attributable to Kraft Foods:
Continuing operations 2.03 1.21 1.56 1.70 1.57
Discontinued operations - 0.69 0.14 0.14 (0.02)
Net earnings attributable to Kraft Foods 2.03 1.90 1.70 1.84 1.55
Dividends declared per share 1.16 1.12 1.04 0.96 0.87
Dividends declared as a % of Basic EPS 56.9% 58.3% 60.8% 52.2% 56.1%
Dividends declared as a % of Diluted EPS 57.1% 58.9% 61.2% 52.2% 56.1%
Weighted-average shares - Basic 1,478 1,505 1,591 1,659 1,699
Weighted-average shares - Diluted 1,486 1,515 1,600 1,661 1,699
Net cash provided by operating activities 5,084 4,141 3,571 3,720 3,464
Capital expenditures 1,330 1,367 1,241 1,169 1,171
Free cash flow* 3,754 2,774 2,330 2,551 2,293
Depreciation 905 963 873 884 869
Property, plant and equipment, net 10,693 9,917 10,778 9,693 9,817
Inventories, net 3,775 3,881 4,238 3,436 3,272
Total assets 66,714 63,173 68,132 55,548 57,597
Long-term debt 18,024 18,589 12,902 7,081 8,475
Total debt 18,990 20,251 21,009 10,821 11,200
Total long-term liabilities 29,251 29,773 23,574 16,520 19,285
Total Kraft Foods Shareholders' Equity 25,876 22,295 27,407 28,536 29,574
Total Equity 25,972 22,356 27,445 28,562 29,600
Book value per common share outstanding 17.51 15.18 17.87 17.44 17.71
Market price per Common Stock
share - high / low 29.84-20.81 34.97-24.75 37.20-29.95 36.67-27.44 35.65-27.88
Closing price of Common Stock at
year end 27.18 26.85 32.63 35.70 28.17
Price / earnings ratio at year end - Basic 13 14 19 19 18
Price / earnings ratio at year end - Diluted 13 14 19 19 18
Shares outstanding at year end 1,478 1,469 1,534 1,636 1,670
Number of employees 97,000 98,000 103,000 90,000 94,000
* Please see Non-GAAP Financial Measures section at the end of Item 7.
17
Source: KRAFT FOODS INC, 10-K, February 25, 2010 Powered by Morningstar® Document Research℠