Kraft 2009 Annual Report Download - page 27
Download and view the complete annual report
Please find page 27 of the 2009 Kraft annual report below. You can navigate through the pages in the report by either clicking on the pages listed below, or by using the keyword search tool below to find specific information within the annual report.-
 1
1 -
2
-
3
-
4
-
5
-
6
-
7
-
8
-
9
-
10
-
11
-
12
-
13
-
14
-
15
-
16
-
 17
17 -
 18
18 -
 19
19 -
 20
20 -
 21
21 -
 22
22 -
 23
23 -
 24
24 -
 25
25 -
 26
26 -
 27
27 -
 28
28 -
 29
29 -
 30
30 -
 31
31 -
 32
32 -
 33
33 -
 34
34 -
 35
35 -
 36
36 -
 37
37 -
38
-
39
-
40
-
41
-
42
-
43
-
44
-
45
-
46
-
47
-
48
-
49
-
50
-
51
-
52
-
53
-
54
-
55
-
56
-
57
-
58
-
59
-
60
-
61
-
62
-
63
-
64
-
65
-
66
-
67
-
68
-
69
-
70
-
71
-
72
-
73
-
74
-
75
-
76
-
77
-
78
-
79
-
80
-
81
-
82
-
83
-
84
-
85
-
86
-
87
-
88
-
89
-
90
-
91
-
92
-
93
-
94
-
95
-
96
-
97
-
98
-
99
-
100
-
101
-
102
-
103
-
104
-
105
-
106
-
107
-
108
-
109
-
110
-
111
-
112
-
113
-
114
-
115
-
116
-
117
-
118
-
119
-
120
-
121
-
122
-
123
-
124
-
125
-
126
-
127
-
128
-
129
-
130
-
131
-
132
-
133
-
134
-
135
-
136
-
137
-
138
-
139
-
140
-
141
-
142
-
143
-
144
-
145
-
146
-
147
-
148
-
149
-
150
-
151
-
152
-
153
-
154
-
155
-
156
-
157
-
158
-
159
-
160
-
161
-
162
-
163
-
164
-
165
-
166
-
167
-
168
-
169
-
170
-
171
-
172
-
173
-
174
-
175
-
176
-
177
-
178
-
179
-
180
-
181
-
182
-
183
-
184
-
185
-
186
-
187
-
188
-
189
-
190
-
191
-
192
-
193
-
194
-
195
-
196
-
197
-
198
-
199
-
200
-
201
-
202
-
203
-
204
-
205
-
206
-
207
-
208
-
209
-
210
-
211
-
212
-
213
-
214
-
215
-
216
-
217
-
218
-
219
-
220
-
221
-
222
-
223
-
224
-
225
-
226
-
227
-
228
-
229
-
230
-
231
-
232
-
233
-
234
-
235
-
236
-
237
-
238
-
239
-
240
-
241
-
242
-
243
 |
 |

Our 2007 effective tax rate included net tax benefits of $184 million, primarily including the effects of dividend repatriation benefits, foreign joint
venture earnings and the effect on foreign deferred taxes from lower foreign tax rates enacted in 2007. The 2007 tax rate also benefited from
foreign earnings taxed below the U.S. federal statutory tax rate, an increased domestic manufacturing deduction, and the divestiture of our
flavored water and juice brand assets and related trademarks. These benefits were partially offset by state tax expense, tax costs associated with
the divestiture of our hot cereal assets and trademarks and interest income from Altria related to the transfer of our federal tax contingencies.
As a result of our spin-off from Altria Group, Inc. (“Altria”), Altria transferred our federal tax contingencies to our balance sheet and related interest
income of $77 million, or $0.03 per diluted share, in 2007. Following our spin-off from Altria, we no longer are a member of the Altria consolidated
tax return group, and we file our own federal consolidated income tax returns.
Consolidated Results of Operations
The following discussion compares our consolidated results of operations for 2009 with 2008, and for 2008 with 2007.
Many factors have an impact on the timing of sales to our customers. These factors include, among others, the timing of holidays and other annual
or special events, seasonality, significant weather conditions, timing of our own or customer incentive programs and pricing actions, customer
inventory programs and general economic conditions. Our domestic operating subsidiaries report year-end results as of the last Saturday of the
year, and our international operating subsidiaries generally report year-end results two weeks prior to the last Saturday of the year.
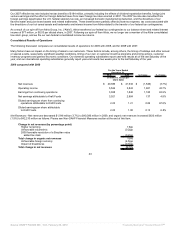
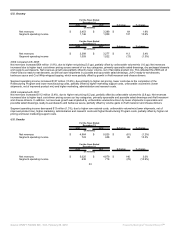
2009 compared with 2008
For the Years Ended
December 31,
2009 2008 $ change % change
(in millions, except per
share data)
Net revenues $ 40,386 $ 41,932 $ (1,546) (3.7%)
Operating income 5,524 3,843 1,681 43.7%
Earnings from continuing operations 3,028 1,848 1,180 63.9%
Net earnings attributable to Kraft Foods 3,021 2,884 137 4.8%
Diluted earnings per share from continuing
operations attributable to Kraft Foods 2.03 1.21 0.82 67.8%
Diluted earnings per share attributable
to Kraft Foods 2.03 1.90 0.13 6.8%
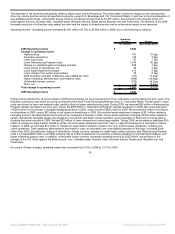
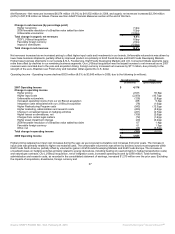
Net Revenues - Net revenues decreased $1,546 million (3.7%) to $40,386 million in 2009, and organic net revenues increased $633 million
(1.5%) to $42,210 million as follows. Please see Non-GAAP Financial Measures section at the end of this Item.
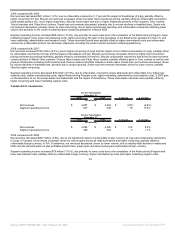
Change in net revenues (by percentage point)
Higher net pricing 1.9pp
Unfavorable volume/mix (0.2)pp
2008 favorable resolution of a Brazilian value
added tax claim (0.2)pp
Total change in organic net revenues 1.5%
Unfavorable foreign currency (4.5)pp
Impact of divestitures (0.7)pp
Total change in net revenues (3.7)%
24
Source: KRAFT FOODS INC, 10-K, February 25, 2010 Powered by Morningstar® Document Research℠