Kraft 2009 Annual Report Download - page 42
Download and view the complete annual report
Please find page 42 of the 2009 Kraft annual report below. You can navigate through the pages in the report by either clicking on the pages listed below, or by using the keyword search tool below to find specific information within the annual report.-
 1
1 -
2
-
3
-
4
-
5
-
6
-
7
-
8
-
9
-
10
-
11
-
12
-
13
-
14
-
15
-
16
-
17
-
18
-
19
-
20
-
21
-
22
-
23
-
24
-
25
-
26
-
27
-
28
-
29
-
30
-
31
-
 32
32 -
 33
33 -
 34
34 -
 35
35 -
 36
36 -
 37
37 -
 38
38 -
 39
39 -
 40
40 -
 41
41 -
 42
42 -
 43
43 -
 44
44 -
 45
45 -
 46
46 -
 47
47 -
 48
48 -
 49
49 -
 50
50 -
 51
51 -
 52
52 -
53
-
54
-
55
-
56
-
57
-
58
-
59
-
60
-
61
-
62
-
63
-
64
-
65
-
66
-
67
-
68
-
69
-
70
-
71
-
72
-
73
-
74
-
75
-
76
-
77
-
78
-
79
-
80
-
81
-
82
-
83
-
84
-
85
-
86
-
87
-
88
-
89
-
90
-
91
-
92
-
93
-
94
-
95
-
96
-
97
-
98
-
99
-
100
-
101
-
102
-
103
-
104
-
105
-
106
-
107
-
108
-
109
-
110
-
111
-
112
-
113
-
114
-
115
-
116
-
117
-
118
-
119
-
120
-
121
-
122
-
123
-
124
-
125
-
126
-
127
-
128
-
129
-
130
-
131
-
132
-
133
-
134
-
135
-
136
-
137
-
138
-
139
-
140
-
141
-
142
-
143
-
144
-
145
-
146
-
147
-
148
-
149
-
150
-
151
-
152
-
153
-
154
-
155
-
156
-
157
-
158
-
159
-
160
-
161
-
162
-
163
-
164
-
165
-
166
-
167
-
168
-
169
-
170
-
171
-
172
-
173
-
174
-
175
-
176
-
177
-
178
-
179
-
180
-
181
-
182
-
183
-
184
-
185
-
186
-
187
-
188
-
189
-
190
-
191
-
192
-
193
-
194
-
195
-
196
-
197
-
198
-
199
-
200
-
201
-
202
-
203
-
204
-
205
-
206
-
207
-
208
-
209
-
210
-
211
-
212
-
213
-
214
-
215
-
216
-
217
-
218
-
219
-
220
-
221
-
222
-
223
-
224
-
225
-
226
-
227
-
228
-
229
-
230
-
231
-
232
-
233
-
234
-
235
-
236
-
237
-
238
-
239
-
240
-
241
-
242
-
243
 |
 |

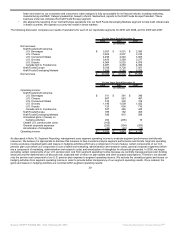
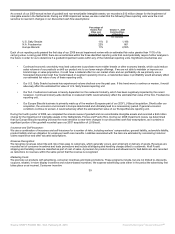
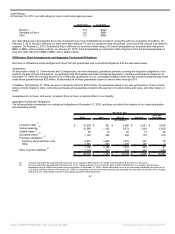
As a result of our 2009 annual review of goodwill and non-amortizable intangible assets, we recorded a $12 million charge for the impairment of
intangible assets in the Netherlands. During our 2009 impairment review, we also noted that the following three reporting units were the most
sensitive to near-term changes in our discounted cash flow assumptions:
Percentage of
Excess Fair
Value over
Carrying Value
October 1, 2009
Carrying Value
of Goodwill
(in millions)
U.S. Salty Snacks 11% $ 1,186
N.A. Foodservice 22% 861
Europe Biscuits 11% 2,555
Each of our reporting units passed the first step of our 2009 annual impairment review with an estimated fair value greater than 110% of its
carrying value. Looking past 2009, there are uncertainties within the three identified reporting units that could potentially require further analysis in
the future in order for us to determine if a goodwill impairment exists within any of the individual reporting units. Significant uncertainties are:
• Continued economic uncertainty may lead customers to purchase more retailer brands or other economy brands, which could reduce
sales volumes of our products or shift our product mix to our lower margin offerings. If we are not able to maintain or improve our
brand image or value proposition, it could have a material effect on our market share and our profitability. As we primarily use a
forecasted discounted cash flow model based on segment operating income, a material decrease in profitability would adversely affect
our estimated fair value of any of these reporting units.
• Our U.S. Salty Snacks business has experienced volume declines over the past year. If this trend were to continue or worsen, it would
adversely affect the estimated fair value of U.S. Salty Snacks reporting unit.
• Our N.A. Foodservice business is heavily dependent on the restaurant industry, which has been negatively impacted by the recent
recession. Continued industry-wide declines in restaurant traffic would adversely affect the estimated fair value of the N.A. Foodservice
reporting unit.
• Our Europe Biscuits business is primarily made up of the western European part of our 2007 LU Biscuit acquisition. Shortly after our
acquisition, the economic environment in Europe deteriorated and ultimately lead to a recessionary period. If general economic
conditions continue to worsen, it would adversely affect the estimated fair value of our Europe Biscuits reporting unit.
During the fourth quarter of 2008, we completed the annual review of goodwill and non-amortizable intangible assets and recorded a $44 million
charge for the impairment of intangible assets in the Netherlands, France and Puerto Rico. During our 2008 impairment review, we determined
that our Europe Biscuits reporting unit was the most sensitive to near-term changes in our discounted cash flow assumptions, as it contains a
significant portion of the goodwill recorded upon our 2007 acquisition of LU Biscuit.
Insurance and Self-Insurance:
We use a combination of insurance and self-insurance for a number of risks, including workers’ compensation, general liability, automobile liability,
product liability and our obligation for employee health care benefits. Liabilities associated with the risks are estimated by considering historical
claims experience and other actuarial assumptions.
Revenue Recognition:
We recognize revenues when title and risk of loss pass to customers, which generally occurs upon shipment or delivery of goods. Revenues are
recorded net of consumer incentives and trade promotions and include all shipping and handling charges billed to customers. Kraft Foods’
shipping and handling costs are classified as part of cost of sales. A provision for product returns and allowances for bad debts are also recorded
as reductions to revenues within the same period that the revenue is recognized.
Marketing Costs:
We promote our products with advertising, consumer incentives and trade promotions. These programs include, but are not limited to, discounts,
coupons, rebates, in-store display incentives and volume-based incentives. We expense advertising costs either in the period the advertising first
takes place or as incurred. Consumer incentive
39
Source: KRAFT FOODS INC, 10-K, February 25, 2010 Powered by Morningstar® Document Research℠