Kraft 2009 Annual Report Download - page 33
Download and view the complete annual report
Please find page 33 of the 2009 Kraft annual report below. You can navigate through the pages in the report by either clicking on the pages listed below, or by using the keyword search tool below to find specific information within the annual report.-
 1
1 -
2
-
3
-
4
-
5
-
6
-
7
-
8
-
9
-
10
-
11
-
12
-
13
-
14
-
15
-
16
-
17
-
18
-
19
-
20
-
21
-
22
-
 23
23 -
 24
24 -
 25
25 -
 26
26 -
 27
27 -
 28
28 -
 29
29 -
 30
30 -
 31
31 -
 32
32 -
 33
33 -
 34
34 -
 35
35 -
 36
36 -
 37
37 -
 38
38 -
 39
39 -
 40
40 -
 41
41 -
 42
42 -
 43
43 -
44
-
45
-
46
-
47
-
48
-
49
-
50
-
51
-
52
-
53
-
54
-
55
-
56
-
57
-
58
-
59
-
60
-
61
-
62
-
63
-
64
-
65
-
66
-
67
-
68
-
69
-
70
-
71
-
72
-
73
-
74
-
75
-
76
-
77
-
78
-
79
-
80
-
81
-
82
-
83
-
84
-
85
-
86
-
87
-
88
-
89
-
90
-
91
-
92
-
93
-
94
-
95
-
96
-
97
-
98
-
99
-
100
-
101
-
102
-
103
-
104
-
105
-
106
-
107
-
108
-
109
-
110
-
111
-
112
-
113
-
114
-
115
-
116
-
117
-
118
-
119
-
120
-
121
-
122
-
123
-
124
-
125
-
126
-
127
-
128
-
129
-
130
-
131
-
132
-
133
-
134
-
135
-
136
-
137
-
138
-
139
-
140
-
141
-
142
-
143
-
144
-
145
-
146
-
147
-
148
-
149
-
150
-
151
-
152
-
153
-
154
-
155
-
156
-
157
-
158
-
159
-
160
-
161
-
162
-
163
-
164
-
165
-
166
-
167
-
168
-
169
-
170
-
171
-
172
-
173
-
174
-
175
-
176
-
177
-
178
-
179
-
180
-
181
-
182
-
183
-
184
-
185
-
186
-
187
-
188
-
189
-
190
-
191
-
192
-
193
-
194
-
195
-
196
-
197
-
198
-
199
-
200
-
201
-
202
-
203
-
204
-
205
-
206
-
207
-
208
-
209
-
210
-
211
-
212
-
213
-
214
-
215
-
216
-
217
-
218
-
219
-
220
-
221
-
222
-
223
-
224
-
225
-
226
-
227
-
228
-
229
-
230
-
231
-
232
-
233
-
234
-
235
-
236
-
237
-
238
-
239
-
240
-
241
-
242
-
243
 |
 |

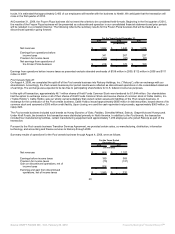
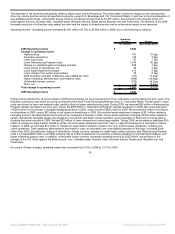
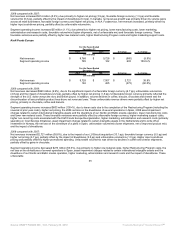
In 2009, unrealized gains on hedging activities of $203 million primarily resulted from the 2008 unrealized losses on energy derivatives becoming
realized in 2009. In 2008, unrealized losses on hedging activities of $205 million were primarily related to energy derivatives, including heating oil
(used primarily to hedge transportation costs) and natural gas contracts. In 2009, general corporate expenses included $50 million of charges for
legal matters related to certain of our European operations (see Part I Item 3. Legal Proceedings for a description of these matters). In 2008, we
recorded $72 million in charges for legal matters related to certain of our U.S. and European operations, including U.S. coffee operations and
represented the primary reason general corporate expenses increased $101 million in 2008.
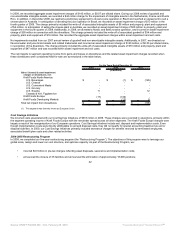
We incurred costs associated with our Cost Savings Initiatives of $318 million in 2009. These charges were recorded in operations, primarily within
the segment operating income of Kraft Foods Europe with the remainder spread across all other segments. In 2009, we also reversed $85 million
of Restructuring Program costs, with the majority relating to our Kraft Foods Europe segment while the remainder was spread across all other
segments. We incurred Restructuring Program costs of $989 million in 2008 and $459 million in 2007. Refer to Note 6, Restructuring Costs, for a
breakout of the 2008 and 2007 charges by segment. We also incurred asset impairment charges of $21 million in 2009 related to our Kraft Foods
Europe segment, $140 million in 2008 related to our Kraft Foods Europe and Kraft Foods Developing Markets segments, and $120 million in 2007
related to our U.S. Beverages segment. Refer to Note 5, Goodwill and Intangible Assets, for further details of these charges.
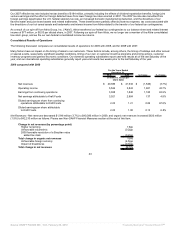
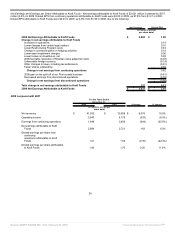
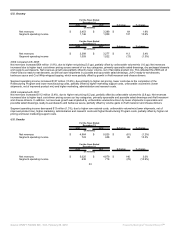
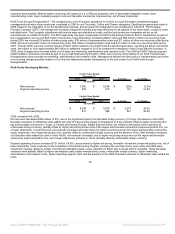
U.S. Beverages
For the Years Ended
December 31,
2009 2008 $ change % change
(in millions)
Net revenues $ 3,057 $ 3,001 $ 56 1.9%
Segment operating income 511 381 130 34.1%
For the Years Ended
December 31,
2008 2007 $ change % change
(in millions)
Net revenues $ 3,001 $ 2,990 $ 11 0.4%
Segment operating income 381 346 35 10.1%
2009 compared with 2008:
Net revenues increased $56 million (1.9%), due to favorable volume/mix (1.3 pp) and higher net pricing (0.6 pp). Favorable volume/mix was driven
by higher shipments in ready-to-drink and powdered beverages. Ready-to-drink beverages grew from successful quality and marketing
investments in Capri Sun, partially offset by the discontinuation of less profitable ready-to-drink product lines. Powdered beverages volume
increased primarily due to strong gains in Kool-Aid and Tang. Coffee volume declined as gains in Maxwell House, Starbucks and Tassimo were
more than offset by declines in Gevalia. These favorable factors were partially offset by unfavorable mix driven by the higher ready-to-drink
volume. Higher net pricing was primarily related to ready-to-drink beverages, partially offset by lower input cost-driven pricing in coffee.
Segment operating income increased $130 million (34.1%), due primarily to lower costs due to the completion of the Restructuring Program, lower
raw material costs, higher net pricing, favorable volume/mix (higher shipments, net of unfavorable product mix), lower manufacturing costs and
lower marketing, administration and research costs, partially offset by higher marketing support costs.
2008 compared with 2007:
Net revenues increased $11 million (0.4%), due to higher net pricing (4.9 pp), partially offset by the impact of divestitures (2.4 pp) and unfavorable
volume/mix (2.1 pp). Higher net pricing reflected input cost-driven pricing in coffee and lower promotional spending in ready-to-drink beverages.
Unfavorable volume/mix was driven by lower shipments, partially offset by improved product mix due to growth in Tassimo. Lower shipments were
driven by declines in ready-to-drink beverages, primarily Capri Sun, partially offset by gains in powdered beverages, primarily Country Time and
Kool-Aid, and Maxwell House mainstream coffee.
30
Source: KRAFT FOODS INC, 10-K, February 25, 2010 Powered by Morningstar® Document Research℠