Kraft 2009 Annual Report Download - page 30
Download and view the complete annual report
Please find page 30 of the 2009 Kraft annual report below. You can navigate through the pages in the report by either clicking on the pages listed below, or by using the keyword search tool below to find specific information within the annual report.-
 1
1 -
2
-
3
-
4
-
5
-
6
-
7
-
8
-
9
-
10
-
11
-
12
-
13
-
14
-
15
-
16
-
17
-
18
-
19
-
 20
20 -
 21
21 -
 22
22 -
 23
23 -
 24
24 -
 25
25 -
 26
26 -
 27
27 -
 28
28 -
 29
29 -
 30
30 -
 31
31 -
 32
32 -
 33
33 -
 34
34 -
 35
35 -
 36
36 -
 37
37 -
 38
38 -
 39
39 -
 40
40 -
41
-
42
-
43
-
44
-
45
-
46
-
47
-
48
-
49
-
50
-
51
-
52
-
53
-
54
-
55
-
56
-
57
-
58
-
59
-
60
-
61
-
62
-
63
-
64
-
65
-
66
-
67
-
68
-
69
-
70
-
71
-
72
-
73
-
74
-
75
-
76
-
77
-
78
-
79
-
80
-
81
-
82
-
83
-
84
-
85
-
86
-
87
-
88
-
89
-
90
-
91
-
92
-
93
-
94
-
95
-
96
-
97
-
98
-
99
-
100
-
101
-
102
-
103
-
104
-
105
-
106
-
107
-
108
-
109
-
110
-
111
-
112
-
113
-
114
-
115
-
116
-
117
-
118
-
119
-
120
-
121
-
122
-
123
-
124
-
125
-
126
-
127
-
128
-
129
-
130
-
131
-
132
-
133
-
134
-
135
-
136
-
137
-
138
-
139
-
140
-
141
-
142
-
143
-
144
-
145
-
146
-
147
-
148
-
149
-
150
-
151
-
152
-
153
-
154
-
155
-
156
-
157
-
158
-
159
-
160
-
161
-
162
-
163
-
164
-
165
-
166
-
167
-
168
-
169
-
170
-
171
-
172
-
173
-
174
-
175
-
176
-
177
-
178
-
179
-
180
-
181
-
182
-
183
-
184
-
185
-
186
-
187
-
188
-
189
-
190
-
191
-
192
-
193
-
194
-
195
-
196
-
197
-
198
-
199
-
200
-
201
-
202
-
203
-
204
-
205
-
206
-
207
-
208
-
209
-
210
-
211
-
212
-
213
-
214
-
215
-
216
-
217
-
218
-
219
-
220
-
221
-
222
-
223
-
224
-
225
-
226
-
227
-
228
-
229
-
230
-
231
-
232
-
233
-
234
-
235
-
236
-
237
-
238
-
239
-
240
-
241
-
242
-
243
 |
 |

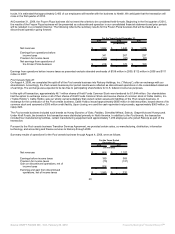
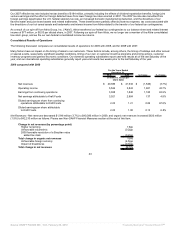
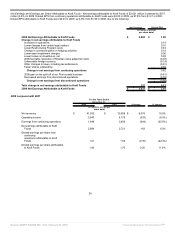
Net Revenues - Net revenues increased $6,074 million (16.9%) to $41,932 million in 2008, and organic net revenues increased $2,394 million
(6.8%) to $37,818 million as follows. Please see Non-GAAP Financial Measures section at the end of this Item.
Change in net revenues (by percentage point)
Higher net pricing 7.4pp
2008 favorable resolution of a Brazilian value added tax claim 0.2pp
Unfavorable volume/mix (0.8)pp
Total change in organic net revenues 6.8%
2007 LU Biscuit acquisition 8.9pp
Favorable foreign currency 2.0pp
Impact of divestitures (0.8)pp
Total change in net revenues 16.9%
Net revenues increased as we increased pricing to offset higher input costs and investments in our brands. Unfavorable volume/mix was driven by
lower base business shipments, partially offset by improved product mix primarily in Kraft Foods Europe and Kraft Foods Developing Markets.
Higher base business shipments in our Canada & N.A. Foodservice, Kraft Foods Developing Markets and U.S. Convenient Meals segments were
more than offset by declines in our remaining business segments. Our LU Biscuit acquisition was the largest increase to net revenues as no 2007
revenues were recorded due to the year-end acquisition timing. Foreign currency increased net revenues by $711 million, due primarily to the
strength of the euro, Brazilian real, Polish zloty and Canadian dollar against the U.S. dollar.
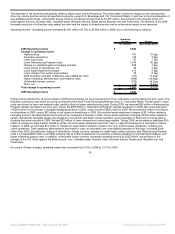
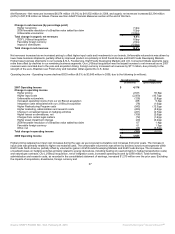
Operating Income - Operating income declined $333 million (8.0%) to $3,843 million in 2008, due to the following (in millions):
Operating Income Change
(in millions) (percentage point)
2007 Operating Income $ 4,176
Change in operating income
Higher pricing 2,633 55.9pp
Higher input costs (2,059) (43.7)pp
Unfavorable volume/mix (128) (2.8)pp
Increased operating income from our LU Biscuit acquisition 438 9.3pp
Integration costs associated with our LU Biscuit acquisition (78) (1.6)pp
Higher Restructuring Program costs (542) (12.3)pp
Higher marketing, administration and research costs (280) (5.9)pp
Change in unrealized losses on hedging activities (221) (4.7)pp
Higher losses on divestitures, net (106) (2.6)pp
Charges from certain legal matters (72) (1.6)pp
Higher asset impairment charges (20) (0.2)pp
2008 favorable resolution of a Brazilian value added tax claim 67 1.4pp
Favorable foreign currency 61 1.3pp
Other, net (26) (0.5)pp
Total change in operating income (333) (8.0)%
2008 Operating Income $ 3,843
Higher pricing outpaced our input cost increases during the year, as we recovered cumulative cost increases from prior years. The increase in
input costs was primarily related to higher raw material costs. The unfavorable volume/mix was driven by declines across most segments within
Kraft Foods North America, partially offset by volume/mix gains in Kraft Foods Developing Markets and Kraft Foods Europe. The increase in
unrealized losses on hedging activities primarily related to energy derivatives, including heating oil (used primarily to hedge transportation costs)
and natural gas contracts. Our LU Biscuit acquisition, net of integration costs, increased operating income by $360 million. Total marketing,
administration and research costs, as recorded in the consolidated statement of earnings, increased $1,275 million over the prior year. Excluding
the impacts of acquisitions, divestitures, foreign currency and
27
Source: KRAFT FOODS INC, 10-K, February 25, 2010 Powered by Morningstar® Document Research℠