Kraft 2009 Annual Report Download - page 35
Download and view the complete annual report
Please find page 35 of the 2009 Kraft annual report below. You can navigate through the pages in the report by either clicking on the pages listed below, or by using the keyword search tool below to find specific information within the annual report.-
 1
1 -
2
-
3
-
4
-
5
-
6
-
7
-
8
-
9
-
10
-
11
-
12
-
13
-
14
-
15
-
16
-
17
-
18
-
19
-
20
-
21
-
22
-
23
-
24
-
 25
25 -
 26
26 -
 27
27 -
 28
28 -
 29
29 -
 30
30 -
 31
31 -
 32
32 -
 33
33 -
 34
34 -
 35
35 -
 36
36 -
 37
37 -
 38
38 -
 39
39 -
 40
40 -
 41
41 -
 42
42 -
 43
43 -
 44
44 -
 45
45 -
46
-
47
-
48
-
49
-
50
-
51
-
52
-
53
-
54
-
55
-
56
-
57
-
58
-
59
-
60
-
61
-
62
-
63
-
64
-
65
-
66
-
67
-
68
-
69
-
70
-
71
-
72
-
73
-
74
-
75
-
76
-
77
-
78
-
79
-
80
-
81
-
82
-
83
-
84
-
85
-
86
-
87
-
88
-
89
-
90
-
91
-
92
-
93
-
94
-
95
-
96
-
97
-
98
-
99
-
100
-
101
-
102
-
103
-
104
-
105
-
106
-
107
-
108
-
109
-
110
-
111
-
112
-
113
-
114
-
115
-
116
-
117
-
118
-
119
-
120
-
121
-
122
-
123
-
124
-
125
-
126
-
127
-
128
-
129
-
130
-
131
-
132
-
133
-
134
-
135
-
136
-
137
-
138
-
139
-
140
-
141
-
142
-
143
-
144
-
145
-
146
-
147
-
148
-
149
-
150
-
151
-
152
-
153
-
154
-
155
-
156
-
157
-
158
-
159
-
160
-
161
-
162
-
163
-
164
-
165
-
166
-
167
-
168
-
169
-
170
-
171
-
172
-
173
-
174
-
175
-
176
-
177
-
178
-
179
-
180
-
181
-
182
-
183
-
184
-
185
-
186
-
187
-
188
-
189
-
190
-
191
-
192
-
193
-
194
-
195
-
196
-
197
-
198
-
199
-
200
-
201
-
202
-
203
-
204
-
205
-
206
-
207
-
208
-
209
-
210
-
211
-
212
-
213
-
214
-
215
-
216
-
217
-
218
-
219
-
220
-
221
-
222
-
223
-
224
-
225
-
226
-
227
-
228
-
229
-
230
-
231
-
232
-
233
-
234
-
235
-
236
-
237
-
238
-
239
-
240
-
241
-
242
-
243
 |
 |

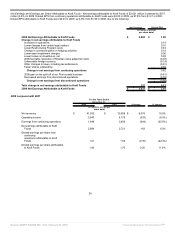
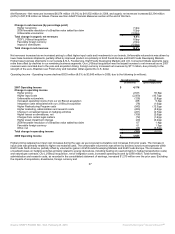
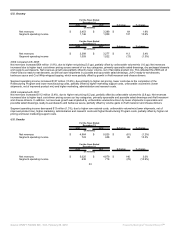
2009 compared with 2008:
Net revenues increased $256 million (6.0%), due to favorable volume/mix (4.6 pp) and higher net pricing (1.4 pp). Net revenues increased in
meats, primarily due to higher net pricing (increased input cost-driven pricing, net of increased promotional spending). Also, volume increased due
to higher shipments in bacon, cold cuts and hot dogs, partially offset by the discontinuation of less profitable product lines. In pizza, net revenues
increased due to the volume growth in our DiGiorno and California Pizza Kitchen premium brands, as well as growth in our Jack’s and Tombstone
pizza brands, partially offset by the unfavorable impact of the discontinuation of less profitable product lines. This was partially offset by lower net
pricing driven by increased promotional spending.
Segment operating income increased $171 million (50.4%), due primarily to favorable volume/mix (higher shipments and improved product mix),
higher net pricing, lower raw material costs, lower costs due to the completion of the Restructuring Program and lower manufacturing costs. These
favorable factors were partially offset by higher marketing support costs and higher marketing, administration and research costs.
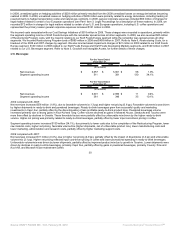
Frozen Pizza Divestiture - On January 4, 2010, we entered into an agreement to sell the assets of our Frozen Pizza business to Nestlé for total
consideration of $3.7 billion. The sale, which is subject to customary conditions, including regulatory clearances, includes the DiGiorno,
Tombstone and Jack’s brands in the U.S., the Delissio brand in Canada and the California Pizza Kitchen trademark license.
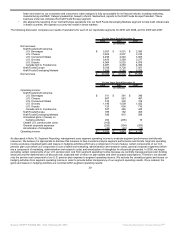
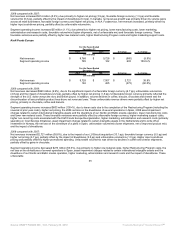
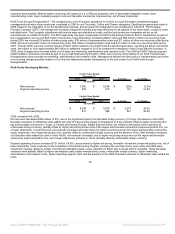
U.S. pizza net revenues increased $174 million (13.5%) to $1,467 million in 2009, due to favorable volume/mix (15.4 pp), partially offset by lower
net pricing (1.9 pp). Favorable volume/mix was driven by volume gains in DiGiorno and California Pizza Kitchen premium brands, as well as
growth in our Jack’s and Tombstone pizza brands. This was partially offset by lower net pricing driven by increased promotional spending. Canada
pizza net revenues were $165 million in 2009.
U.S. pizza segment operating income increased $62 million (29.0%) to $276 million in 2009, due primarily to favorable volume/mix (higher
shipments and improved product mix), lower raw material costs and lower manufacturing costs. These favorable factors were partially offset by
higher marketing support costs, higher marketing, administration and research costs and lower net pricing. Canada pizza segment operating
income was $65 million in 2009.
The combined segment operating income for Frozen Pizza as presented excludes stranded overheads of $108.
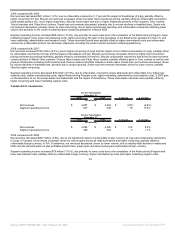
2008 compared with 2007:
Net revenues increased $335 million (8.6%), due to higher net pricing (5.6 pp) and favorable volume/mix (3.0 pp). Net revenues increased in
meats due to higher net pricing, driven by input cost-driven pricing in sandwich meats, Lunchables and hot dogs. Also contributing to meats net
revenue growth was higher shipments of bacon, as well as new product introductions, including Oscar Mayer Deli Creations sandwiches
(flatbreads) and Oscar Mayer Deli Fresh meats (shaved singles and carved). In pizza, net revenues increased due to higher input cost-driven
pricing, net of increased promotional spending, volume growth in DiGiorno and California Pizza Kitchen premium brands and the launch of the For
One product line of individual size pizzas.
Segment operating income increased $20 million (6.3%), due primarily to higher net pricing, favorable volume/mix and lower marketing support
costs, partially offset by higher raw material costs, higher marketing, administration and research costs, higher manufacturing costs and higher
Restructuring Program costs.
32
Source: KRAFT FOODS INC, 10-K, February 25, 2010 Powered by Morningstar® Document Research℠