Kraft 2009 Annual Report Download - page 34
Download and view the complete annual report
Please find page 34 of the 2009 Kraft annual report below. You can navigate through the pages in the report by either clicking on the pages listed below, or by using the keyword search tool below to find specific information within the annual report.-
 1
1 -
2
-
3
-
4
-
5
-
6
-
7
-
8
-
9
-
10
-
11
-
12
-
13
-
14
-
15
-
16
-
17
-
18
-
19
-
20
-
21
-
22
-
23
-
 24
24 -
 25
25 -
 26
26 -
 27
27 -
 28
28 -
 29
29 -
 30
30 -
 31
31 -
 32
32 -
 33
33 -
 34
34 -
 35
35 -
 36
36 -
 37
37 -
 38
38 -
 39
39 -
 40
40 -
 41
41 -
 42
42 -
 43
43 -
 44
44 -
45
-
46
-
47
-
48
-
49
-
50
-
51
-
52
-
53
-
54
-
55
-
56
-
57
-
58
-
59
-
60
-
61
-
62
-
63
-
64
-
65
-
66
-
67
-
68
-
69
-
70
-
71
-
72
-
73
-
74
-
75
-
76
-
77
-
78
-
79
-
80
-
81
-
82
-
83
-
84
-
85
-
86
-
87
-
88
-
89
-
90
-
91
-
92
-
93
-
94
-
95
-
96
-
97
-
98
-
99
-
100
-
101
-
102
-
103
-
104
-
105
-
106
-
107
-
108
-
109
-
110
-
111
-
112
-
113
-
114
-
115
-
116
-
117
-
118
-
119
-
120
-
121
-
122
-
123
-
124
-
125
-
126
-
127
-
128
-
129
-
130
-
131
-
132
-
133
-
134
-
135
-
136
-
137
-
138
-
139
-
140
-
141
-
142
-
143
-
144
-
145
-
146
-
147
-
148
-
149
-
150
-
151
-
152
-
153
-
154
-
155
-
156
-
157
-
158
-
159
-
160
-
161
-
162
-
163
-
164
-
165
-
166
-
167
-
168
-
169
-
170
-
171
-
172
-
173
-
174
-
175
-
176
-
177
-
178
-
179
-
180
-
181
-
182
-
183
-
184
-
185
-
186
-
187
-
188
-
189
-
190
-
191
-
192
-
193
-
194
-
195
-
196
-
197
-
198
-
199
-
200
-
201
-
202
-
203
-
204
-
205
-
206
-
207
-
208
-
209
-
210
-
211
-
212
-
213
-
214
-
215
-
216
-
217
-
218
-
219
-
220
-
221
-
222
-
223
-
224
-
225
-
226
-
227
-
228
-
229
-
230
-
231
-
232
-
233
-
234
-
235
-
236
-
237
-
238
-
239
-
240
-
241
-
242
-
243
 |
 |

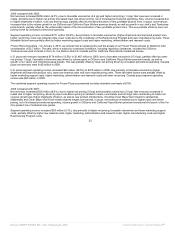
Segment operating income increased $35 million (10.1%), due primarily to higher net pricing, a 2007 asset impairment charge related to our
flavored water and juice brand assets and related trademarks, the impact of divestitures and lower manufacturing costs. These favorable factors
were partially offset by higher raw material costs, higher Restructuring Program costs, unfavorable volume/mix and higher marketing,
administration and research costs.
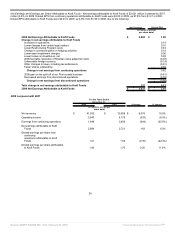
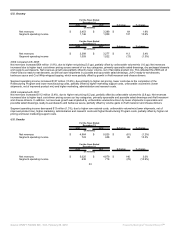
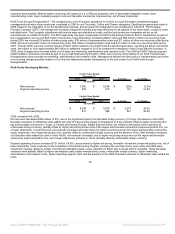
U.S. Cheese
For the Years Ended
December 31,
2009 2008 $ change % change
(in millions)
Net revenues $ 3,605 $ 4,007 $ (402) (10.0%)
Segment operating income 667 563 104 18.5%
For the Years Ended
December 31,
2008 2007 $ change % change
(in millions)
Net revenues $ 4,007 $ 3,745 $ 262 7.0%
Segment operating income 563 487 76 15.6%
2009 compared with 2008:
Net revenues decreased $402 million (10.0%), due to lower net pricing (8.8 pp) and unfavorable volume/mix (1.2 pp). Lower net pricing was due to
lower input cost-driven pricing combined with increases in promotional spending. Net revenues also declined due to lower shipments, primarily in
cultured and natural cheese products.
Segment operating income increased $104 million (18.5%), due primarily to lower raw material costs (primarily lower dairy costs), lower
manufacturing costs, lower costs due to the completion of the Restructuring Program and lower marketing, administration and research costs,
partially offset by lower net pricing and higher marketing support costs.
2008 compared with 2007:
Net revenues increased $262 million (7.0%), due to higher net pricing (14.1 pp), partially offset by unfavorable volume/mix (7.1 pp). Higher net
pricing reflected input cost-driven pricing, partially offset by increased promotional spending in our natural cheese category. Unfavorable
volume/mix was driven primarily by shipment declines in all of our major cheese categories, partially offset by new product innovations, primarily
Kraft Bagel-fuls.
Segment operating income increased $76 million (15.6%), due primarily to higher net pricing and lower Restructuring Program costs, partially
offset by higher raw material costs, unfavorable volume/mix, higher manufacturing costs and higher marketing, administration and research costs.
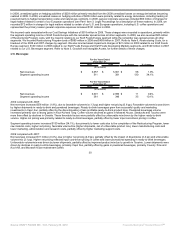
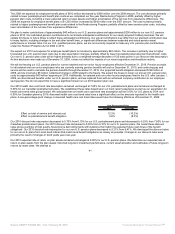
U.S. Convenient Meals
For the Years Ended
December 31,
2009 2008 $ change % change
(in millions)
Net revenues $ 4,496 $ 4,240 $ 256 6.0%
Segment operating income 510 339 171 50.4%
For the Years Ended
December 31,
2008 2007 $ change % change
(in millions)
Net revenues $ 4,240 $ 3,905 $ 335 8.6%
Segment operating income 339 319 20 6.3%
31
Source: KRAFT FOODS INC, 10-K, February 25, 2010 Powered by Morningstar® Document Research℠