Kraft 2009 Annual Report Download - page 104
Download and view the complete annual report
Please find page 104 of the 2009 Kraft annual report below. You can navigate through the pages in the report by either clicking on the pages listed below, or by using the keyword search tool below to find specific information within the annual report.-
 1
1 -
2
-
3
-
4
-
5
-
6
-
7
-
8
-
9
-
10
-
11
-
12
-
13
-
14
-
15
-
16
-
17
-
18
-
19
-
20
-
21
-
22
-
23
-
24
-
25
-
26
-
27
-
28
-
29
-
30
-
31
-
32
-
33
-
34
-
35
-
36
-
37
-
38
-
39
-
40
-
41
-
42
-
43
-
44
-
45
-
46
-
47
-
48
-
49
-
50
-
51
-
52
-
53
-
54
-
55
-
56
-
57
-
58
-
59
-
60
-
61
-
62
-
63
-
64
-
65
-
66
-
67
-
68
-
69
-
70
-
71
-
72
-
73
-
74
-
75
-
76
-
77
-
78
-
79
-
80
-
81
-
82
-
83
-
84
-
85
-
86
-
87
-
88
-
89
-
90
-
91
-
92
-
93
-
 94
94 -
 95
95 -
 96
96 -
 97
97 -
 98
98 -
 99
99 -
 100
100 -
 101
101 -
 102
102 -
 103
103 -
 104
104 -
 105
105 -
 106
106 -
 107
107 -
 108
108 -
 109
109 -
 110
110 -
 111
111 -
 112
112 -
 113
113 -
 114
114 -
115
-
116
-
117
-
118
-
119
-
120
-
121
-
122
-
123
-
124
-
125
-
126
-
127
-
128
-
129
-
130
-
131
-
132
-
133
-
134
-
135
-
136
-
137
-
138
-
139
-
140
-
141
-
142
-
143
-
144
-
145
-
146
-
147
-
148
-
149
-
150
-
151
-
152
-
153
-
154
-
155
-
156
-
157
-
158
-
159
-
160
-
161
-
162
-
163
-
164
-
165
-
166
-
167
-
168
-
169
-
170
-
171
-
172
-
173
-
174
-
175
-
176
-
177
-
178
-
179
-
180
-
181
-
182
-
183
-
184
-
185
-
186
-
187
-
188
-
189
-
190
-
191
-
192
-
193
-
194
-
195
-
196
-
197
-
198
-
199
-
200
-
201
-
202
-
203
-
204
-
205
-
206
-
207
-
208
-
209
-
210
-
211
-
212
-
213
-
214
-
215
-
216
-
217
-
218
-
219
-
220
-
221
-
222
-
223
-
224
-
225
-
226
-
227
-
228
-
229
-
230
-
231
-
232
-
233
-
234
-
235
-
236
-
237
-
238
-
239
-
240
-
241
-
242
-
243
 |
 |

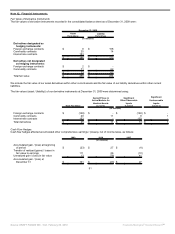
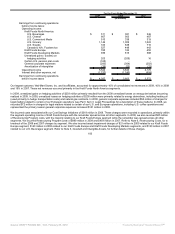
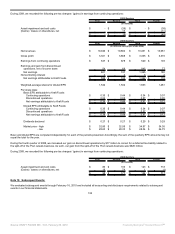
As described in Note 2, Acquisitions and Divestitures, we divested several operations, and recorded net gains / (losses) on these divestitures in
segment operating income as follows:
For the Years Ended December 31,
2009 2008 2007
(in millions)
Kraft Foods North America:
U.S. Beverages $ - $ (1) $ (6)
U.S. Cheese - - -
U.S. Convenient Meals - - -
U.S. Grocery - - -
U.S. Snacks 11 - 12
Canada & N.A. Foodservice - - -
Kraft Foods Europe (17) (91) -
Kraft Foods Developing Markets - - 8
Gains / (losses) on divestitures, net $ (6) $ (92) $ 14
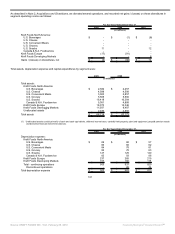
Total assets, depreciation expense and capital expenditures by segment were:
2009 2008
(in millions)
Total assets:
Kraft Foods North America:
U.S. Beverages $ 2,382 $ 2,257
U.S. Cheese 4,589 4,599
U.S. Convenient Meals 3,063 2,857
U.S. Grocery 5,565 5,500
U.S. Snacks 16,418 16,384
Canada & N.A. Foodservice 5,051 4,888
Kraft Foods Europe 16,073 14,346
Kraft Foods Developing Markets 11,087 9,487
Unallocated assets (1)
2,486 2,855
Total assets $ 66,714 $ 63,173
(1) Unallocated assets consist primarily of cash and cash equivalents, deferred income taxes, centrally held property, plant and equipment, prepaid pension assets
and derivative financial instrument balances.
For the Years Ended December 31,
2009 2008 2007
(in millions)
Depreciation expense:
Kraft Foods North America:
U.S. Beverages $ 69 $ 68 $ 57
U.S. Cheese 66 66 62
U.S. Convenient Meals 84 78 81
U.S. Grocery 82 78 63
U.S. Snacks 127 129 140
Canada & N.A. Foodservice 83 93 96
Kraft Foods Europe 237 265 215
Kraft Foods Developing Markets 157 160 115
Total - continuing operations 905 937 829
Discontinued operations - 26 44
Total depreciation expense $ 905 $ 963 $ 873
101
Source: KRAFT FOODS INC, 10-K, February 25, 2010 Powered by Morningstar® Document Research℠