Kraft 2009 Annual Report Download - page 44
Download and view the complete annual report
Please find page 44 of the 2009 Kraft annual report below. You can navigate through the pages in the report by either clicking on the pages listed below, or by using the keyword search tool below to find specific information within the annual report.-
 1
1 -
2
-
3
-
4
-
5
-
6
-
7
-
8
-
9
-
10
-
11
-
12
-
13
-
14
-
15
-
16
-
17
-
18
-
19
-
20
-
21
-
22
-
23
-
24
-
25
-
26
-
27
-
28
-
29
-
30
-
31
-
32
-
33
-
 34
34 -
 35
35 -
 36
36 -
 37
37 -
 38
38 -
 39
39 -
 40
40 -
 41
41 -
 42
42 -
 43
43 -
 44
44 -
 45
45 -
 46
46 -
 47
47 -
 48
48 -
 49
49 -
 50
50 -
 51
51 -
 52
52 -
 53
53 -
 54
54 -
55
-
56
-
57
-
58
-
59
-
60
-
61
-
62
-
63
-
64
-
65
-
66
-
67
-
68
-
69
-
70
-
71
-
72
-
73
-
74
-
75
-
76
-
77
-
78
-
79
-
80
-
81
-
82
-
83
-
84
-
85
-
86
-
87
-
88
-
89
-
90
-
91
-
92
-
93
-
94
-
95
-
96
-
97
-
98
-
99
-
100
-
101
-
102
-
103
-
104
-
105
-
106
-
107
-
108
-
109
-
110
-
111
-
112
-
113
-
114
-
115
-
116
-
117
-
118
-
119
-
120
-
121
-
122
-
123
-
124
-
125
-
126
-
127
-
128
-
129
-
130
-
131
-
132
-
133
-
134
-
135
-
136
-
137
-
138
-
139
-
140
-
141
-
142
-
143
-
144
-
145
-
146
-
147
-
148
-
149
-
150
-
151
-
152
-
153
-
154
-
155
-
156
-
157
-
158
-
159
-
160
-
161
-
162
-
163
-
164
-
165
-
166
-
167
-
168
-
169
-
170
-
171
-
172
-
173
-
174
-
175
-
176
-
177
-
178
-
179
-
180
-
181
-
182
-
183
-
184
-
185
-
186
-
187
-
188
-
189
-
190
-
191
-
192
-
193
-
194
-
195
-
196
-
197
-
198
-
199
-
200
-
201
-
202
-
203
-
204
-
205
-
206
-
207
-
208
-
209
-
210
-
211
-
212
-
213
-
214
-
215
-
216
-
217
-
218
-
219
-
220
-
221
-
222
-
223
-
224
-
225
-
226
-
227
-
228
-
229
-
230
-
231
-
232
-
233
-
234
-
235
-
236
-
237
-
238
-
239
-
240
-
241
-
242
-
243
 |
 |

The 2009 net expense for employee benefit plans of $912 million decreased by $308 million over the 2008 amount. The cost decrease primarily
related to lower postemployment benefit plan costs as we completed our five-year Restructuring Program in 2008, partially offset by higher
pension plan costs, including a lower expected return on plan assets and higher amortization of the net loss from experience differences. The
2008 net expense for employee benefit plans of $1,220 million increased by $343 million over the 2007 amount. The cost increase primarily
related to higher postemployment benefit plan costs related to the Restructuring Program, partially offset by lower pension plan costs, including
lower amortization of the net loss from experience differences.
We plan to make contributions of approximately $40 million to our U.S. pension plans and approximately $200 million to our non-U.S. pension
plans in 2010. Our estimated pension contributions do not include anticipated contributions for our newly acquired Cadbury business. We will
update this figure in future filings to reflect these anticipated contributions. Our actual contributions may differ from our planned contributions due
to many factors, including changes in tax and other benefit laws, or significant differences between expected and actual pension asset
performance or interest rates. For our U.S. qualified pension plans, we are not currently required to make any U.S. pension plan contributions
under the Pension Protection Act of 2006 in 2010.
We expect our 2010 net expense for employee benefit plans to increase by approximately $40 million. The increase is primarily due to higher
forecasted non-U.S. pension plan costs due to plan assumption changes, partially offset by lower forecasted postemployment benefit plan costs.
Our non-U.S. pension plan costs will be higher primarily due to a weighted-average decrease of 120 basis points in our discount rate assumption.
As this disclosure was made as of December 31, 2009, it does not reflect the impacts of our recent acquisition and divestiture activity.
We will be freezing our U.S. pension plans for current salaried and non-union hourly employees effective December 31, 2019. Pension accruals
for all salaried and non-union employees who are currently earning pension benefits will end on December 31, 2019, and continuing pay and
service will be used to calculate the pension benefits through December 31, 2019. Our projected benefit obligation decreased $168 million in
2009, and we incurred a $5 million curtailment charge in 2009 related to the freeze. We expect the freeze to lower our annual U.S. pension plan
costs by approximately $40 million beginning in 2010. Additionally, for salaried and non-union hourly employees hired in the U.S. after January 1,
2009, we discontinued benefits under our U.S. pension plans, and we replaced them with an enhanced company contribution to our employee
savings plan. We do not expect this to have a significant impact on our 2010 pension plan cost.
Our 2010 health care cost trend rate assumption remained unchanged at 7.00% for our U.S. postretirement plans and remained unchanged at
9.00% for our Canadian postretirement plans. We established these rates based upon our most recent experience as well as our expectation for
health care trend rates going forward. We anticipate that our health care cost trend rate assumption will be 5.00% for U.S. plans by 2014 and
6.00% for Canadian plans by 2016. Assumed health care cost trend rates have a significant effect on the amounts reported for the health care
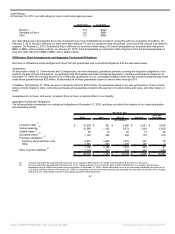
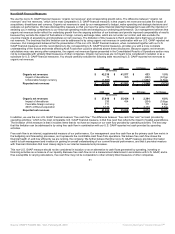
plans. A one-percentage-point change in assumed health care cost trend rates would have the following effects as of December 31, 2009:
One-Percentage-Point
Increase Decrease
Effect on total of service and interest cost 12.3% (10.2%)
Effect on postretirement benefit obligation 9.8% (8.3%)
Our 2010 discount rate assumption decreased to 5.70% from 6.10% for our U.S. postretirement plans and decreased to 5.25% from 7.60% for our
Canadian postretirement plans. Our 2010 discount rate decreased to 5.93% from 6.10% for our U.S. pension plans. We model these discount
rates using a portfolio of high quality, fixed-income debt instruments with durations that match the expected future cash flows of the benefit
obligations. Our 2010 discount rate assumption for our non-U.S. pension plans decreased to 5.21% from 6.41%. We developed the discount rates
for our non-U.S. plans from local bond indices that match local benefit obligations as closely as possible. Changes in our discount rates were
primarily the result of changes in bond yields year-over-year.
Our 2010 expected rate of return on plan assets remained unchanged at 8.00% for our U.S. pension plans. We determine our expected rate of
return on plan assets from the plan assets’ historical long-term investment performance, current asset allocation and estimates of future long-term
returns by asset class. We attempt to
41
Source: KRAFT FOODS INC, 10-K, February 25, 2010 Powered by Morningstar® Document Research℠