Kraft 2009 Annual Report Download - page 232
Download and view the complete annual report
Please find page 232 of the 2009 Kraft annual report below. You can navigate through the pages in the report by either clicking on the pages listed below, or by using the keyword search tool below to find specific information within the annual report.-
 1
1 -
2
-
3
-
4
-
5
-
6
-
7
-
8
-
9
-
10
-
11
-
12
-
13
-
14
-
15
-
16
-
17
-
18
-
19
-
20
-
21
-
22
-
23
-
24
-
25
-
26
-
27
-
28
-
29
-
30
-
31
-
32
-
33
-
34
-
35
-
36
-
37
-
38
-
39
-
40
-
41
-
42
-
43
-
44
-
45
-
46
-
47
-
48
-
49
-
50
-
51
-
52
-
53
-
54
-
55
-
56
-
57
-
58
-
59
-
60
-
61
-
62
-
63
-
64
-
65
-
66
-
67
-
68
-
69
-
70
-
71
-
72
-
73
-
74
-
75
-
76
-
77
-
78
-
79
-
80
-
81
-
82
-
83
-
84
-
85
-
86
-
87
-
88
-
89
-
90
-
91
-
92
-
93
-
94
-
95
-
96
-
97
-
98
-
99
-
100
-
101
-
102
-
103
-
104
-
105
-
106
-
107
-
108
-
109
-
110
-
111
-
112
-
113
-
114
-
115
-
116
-
117
-
118
-
119
-
120
-
121
-
122
-
123
-
124
-
125
-
126
-
127
-
128
-
129
-
130
-
131
-
132
-
133
-
134
-
135
-
136
-
137
-
138
-
139
-
140
-
141
-
142
-
143
-
144
-
145
-
146
-
147
-
148
-
149
-
150
-
151
-
152
-
153
-
154
-
155
-
156
-
157
-
158
-
159
-
160
-
161
-
162
-
163
-
164
-
165
-
166
-
167
-
168
-
169
-
170
-
171
-
172
-
173
-
174
-
175
-
176
-
177
-
178
-
179
-
180
-
181
-
182
-
183
-
184
-
185
-
186
-
187
-
188
-
189
-
190
-
191
-
192
-
193
-
194
-
195
-
196
-
197
-
198
-
199
-
200
-
201
-
202
-
203
-
204
-
205
-
206
-
207
-
208
-
209
-
210
-
211
-
212
-
213
-
214
-
215
-
216
-
217
-
218
-
219
-
220
-
221
-
 222
222 -
 223
223 -
 224
224 -
 225
225 -
 226
226 -
 227
227 -
 228
228 -
 229
229 -
 230
230 -
 231
231 -
 232
232 -
 233
233 -
 234
234 -
 235
235 -
 236
236 -
 237
237 -
 238
238 -
 239
239 -
 240
240 -
 241
241 -
 242
242 -
243
 |
 |

Segment Reporting:
Segment Reporting:
(USD $)
12 Months Ended
12/31/2009
Segment Reporting:
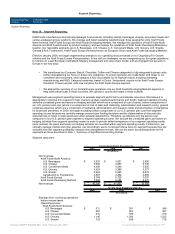
Note 16. Segment Reporting:
Kraft Foods manufactures and markets packaged food products, including snacks, beverages, cheese, convenient meals and
various packaged grocery products. We manage and report operating results through three geographic units: Kraft Foods
North America, Kraft Foods Europe and Kraft Foods Developing Markets. We manage the operations of Kraft Foods North
America and Kraft Foods Europe by product category, and we manage the operations of Kraft Foods Developing Markets by
location. Our reportable segments are U.S. Beverages, U.S. Cheese, U.S. Convenient Meals, U.S. Grocery, U.S. Snacks,
Canada & N.A. Foodservice, Kraft Foods Europe (formerly known as European Union) and Kraft Foods Developing Markets.
Effective January 2009, we began implementing changes to our operating structure based on our Organizing For Growth
initiative and the Kraft Foods Europe Reorganization. In line with our strategies, we are reorganizing our European operations
to function on a pan-European centralized category management and value chain model, and we changed how we work in
Europe in two key ways:
• We transitioned our European Biscuit, Chocolate, Coffee and Cheese categories to fully integrated business units,
further strengthening our focus on these core categories. To ensure decisions are made faster and closer to our
customers and consumers, each category is fully accountable for its financial results, including marketing,
manufacturing and R&D. Category leadership, based in Zurich, Switzerland, reports to the Kraft Foods Europe
President. These business units now comprise the Kraft Foods Europe segment.
• We aligned the reporting of our Central Europe operations into our Kraft Foods Developing Markets segment to
help build critical scale in these countries. We operate a country-led model in these markets.
Management uses segment operating income to evaluate segment performance and allocate resources. We believe it is
appropriate to disclose this measure to help investors analyze segment performance and trends. Segment operating income
excludes unrealized gains and losses on hedging activities (which are a component of cost of sales), certain components of
our U.S. pension plan cost (which is a component of cost of sales and marketing, administration and research costs), general
corporate expenses (which are a component of marketing, administration and research costs) and amortization of intangibles
for all periods presented. In 2009, we began excluding certain components of our U.S. pension plan cost from segment
operating income because we centrally manage pension plan funding decisions and the determination of discount rate,
expected rate of return on plan assets and other actuarial assumptions. Therefore, we allocate only the service cost
component of our U.S. pension plan expense to segment operating income. We exclude the unrealized gains and losses on
hedging activities from segment operating income in order to provide better transparency of our segment operating results.
Once realized, the gains and losses on hedging activities are recorded within segment operating results. Furthermore, we
centrally manage interest and other expense, net. Accordingly, we do not present these items by segment because they are
excluded from the segment profitability measure that management reviews. We use the same accounting policies for the
segments as those described in Note 1, Summary of Significant Accounting Policies.
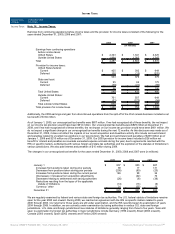
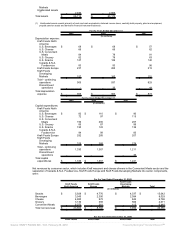
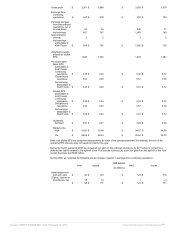
Segment data were:
For the Years Ended December 31,
2009 2008 2007
(in millions)
Net revenues:
Kraft Foods North America:
U.S. Beverages $ 3,057 $ 3,001 $ 2,990
U.S. Cheese 3,605 4,007 3,745
U.S. Convenient Meals 4,496 4,240 3,905
U.S. Grocery 3,453 3,389 3,277
U.S. Snacks 4,964 5,025 4,879
Canada & N.A. Foodservice 4,087 4,294 4,080
Kraft Foods Europe 8,768 9,728 7,007
Kraft Foods Developing Markets 7,956 8,248 5,975
Net revenues $ 40,386 $ 41,932 $ 35,858
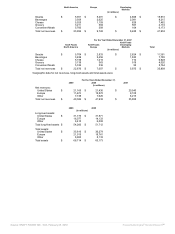
For the Years Ended December 31,
2009 2008 2007
(in millions)
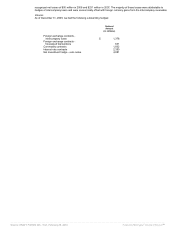
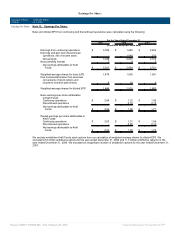
Earnings from continuing operations
before income taxes:
Operating income:
Kraft Foods North America:
U.S. Beverages $ 511 $ 381 $ 346
U.S. Cheese 667 563 487
U.S. Convenient Meals 510 339 319
U.S. Grocery 1,146 1,009 1,022
U.S. Snacks 723 638 716
Source: KRAFT FOODS INC, 10-K, February 25, 2010 Powered by Morningstar® Document Research℠