Kraft 2009 Annual Report Download - page 28
Download and view the complete annual report
Please find page 28 of the 2009 Kraft annual report below. You can navigate through the pages in the report by either clicking on the pages listed below, or by using the keyword search tool below to find specific information within the annual report.-
 1
1 -
2
-
3
-
4
-
5
-
6
-
7
-
8
-
9
-
10
-
11
-
12
-
13
-
14
-
15
-
16
-
17
-
 18
18 -
 19
19 -
 20
20 -
 21
21 -
 22
22 -
 23
23 -
 24
24 -
 25
25 -
 26
26 -
 27
27 -
 28
28 -
 29
29 -
 30
30 -
 31
31 -
 32
32 -
 33
33 -
 34
34 -
 35
35 -
 36
36 -
 37
37 -
 38
38 -
39
-
40
-
41
-
42
-
43
-
44
-
45
-
46
-
47
-
48
-
49
-
50
-
51
-
52
-
53
-
54
-
55
-
56
-
57
-
58
-
59
-
60
-
61
-
62
-
63
-
64
-
65
-
66
-
67
-
68
-
69
-
70
-
71
-
72
-
73
-
74
-
75
-
76
-
77
-
78
-
79
-
80
-
81
-
82
-
83
-
84
-
85
-
86
-
87
-
88
-
89
-
90
-
91
-
92
-
93
-
94
-
95
-
96
-
97
-
98
-
99
-
100
-
101
-
102
-
103
-
104
-
105
-
106
-
107
-
108
-
109
-
110
-
111
-
112
-
113
-
114
-
115
-
116
-
117
-
118
-
119
-
120
-
121
-
122
-
123
-
124
-
125
-
126
-
127
-
128
-
129
-
130
-
131
-
132
-
133
-
134
-
135
-
136
-
137
-
138
-
139
-
140
-
141
-
142
-
143
-
144
-
145
-
146
-
147
-
148
-
149
-
150
-
151
-
152
-
153
-
154
-
155
-
156
-
157
-
158
-
159
-
160
-
161
-
162
-
163
-
164
-
165
-
166
-
167
-
168
-
169
-
170
-
171
-
172
-
173
-
174
-
175
-
176
-
177
-
178
-
179
-
180
-
181
-
182
-
183
-
184
-
185
-
186
-
187
-
188
-
189
-
190
-
191
-
192
-
193
-
194
-
195
-
196
-
197
-
198
-
199
-
200
-
201
-
202
-
203
-
204
-
205
-
206
-
207
-
208
-
209
-
210
-
211
-
212
-
213
-
214
-
215
-
216
-
217
-
218
-
219
-
220
-
221
-
222
-
223
-
224
-
225
-
226
-
227
-
228
-
229
-
230
-
231
-
232
-
233
-
234
-
235
-
236
-
237
-
238
-
239
-
240
-
241
-
242
-
243
 |
 |

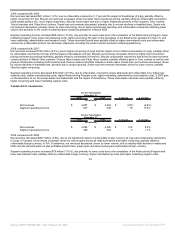
The decrease in net revenues was partially offset by higher input cost-driven pricing. The unfavorable volume/mix impact on net revenues was
driven by volume declines across all reportable segments, except U.S. Beverages and U.S. Convenient Meals, in part due to the discontinuation of
less profitable product lines. Unfavorable foreign currency decreased net revenues by $1,897 million, due primarily to the strength of the U.S.
dollar against the euro, Russian ruble, Canadian dollar, Ukrainian hryvnia, British pound, Brazilian real and Polish zloty. The absence of the 2008
favorable resolution of a Brazilian value added tax claim and the impact of divestitures also had an unfavorable impact on net revenues.
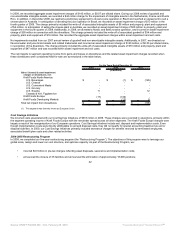
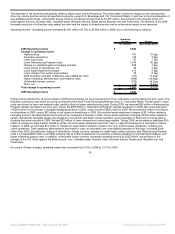
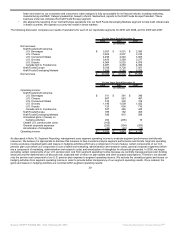
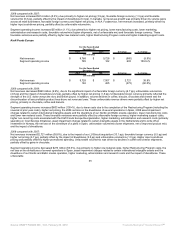
Operating Income - Operating income increased $1,681 million (43.7%) to $5,524 million in 2009, due to the following (in millions):
Operating
Income Change
(in millions) (percentage point)
2008 Operating Income $ 3,843
Change in operating income
Higher pricing 781 15.0pp
Favorable volume/mix 195 3.8pp
Lower input costs 97 1.7pp
Lower Restructuring Program costs 1,074 30.2pp
Change in unrealized gains on hedging activities 408 7.9pp
Lower losses on divestitures, net 86 3.3pp
Lower asset impairment charges 119 2.9pp
Lower charges from certain legal matters 22 0.7pp
2008 favorable resolution of Brazilian value added tax claim (67) (1.3)pp
Higher marketing, administration and research costs (694) (13.4)pp
Unfavorable foreign currency (322) (6.3)pp
Other, net (18) (0.8)pp
Total change in operating income 1,681 43.7%
2009 Operating Income $ 5,524
Higher pricing reflected the carryover impact of 2008 pricing actions, as we recovered some of our cumulative cost increases from prior years. The
favorable volume/mix was driven by strong contributions from Kraft Foods Developing Markets and U.S. Convenient Meals. The decrease in input
costs was driven by lower raw material costs, partially offset by higher manufacturing costs. During 2009, we reversed $85 million in Restructuring
Program charges recorded in the prior year, versus the $989 million in Restructuring Program charges recognized in 2008. We recognized gains
of $203 million on the change in unrealized hedging positions in 2009, versus losses of $205 million in 2008. We recorded $6 million of net losses
on divestitures in 2009, versus $92 million of net losses on divestitures in 2008. We recorded asset impairment charges of $21 million related to
intangible assets in the Netherlands and to write off an investment in Norway in 2009, versus asset impairment charges of $140 million related to
certain international intangible assets, the divestiture of our Nordic and Baltic snacks operation, a juice operation in Brazil and a cheese plant in
Australia that were recorded in 2008. We had $22 million of lower charges from certain legal matters. During 2009, we recorded an additional $50
million of charges for legal matters related to certain of our European operations (see Part I Item 3. Legal Proceedings for a description of these
matters). In 2008, we recorded $72 million in charges for legal matters related to certain of our U.S. and European operations, including U.S.
coffee operations. Total marketing, administration and research costs, as recorded in the consolidated statement of earnings, increased $246
million from 2008. Excluding the impacts of divestitures, foreign currency, charges for certain legal matters and prior year Restructuring Program
costs it increased $694 million over 2008, primarily due to further investments in our brands, including spending on Cost Savings Initiatives, and
higher marketing support costs. In addition, unfavorable foreign currency decreased operating income by $322 million, due primarily to the
strength of the U.S. dollar against the British pound, euro, Canadian dollar, Russian ruble, Ukrainian hryvnia, Korean won, Brazilian real, and
Polish zloty.
As a result of these changes, operating margin also increased from 9.2% in 2008 to 13.7% in 2009.
25
Source: KRAFT FOODS INC, 10-K, February 25, 2010 Powered by Morningstar® Document Research℠