Kraft 2009 Annual Report Download - page 31
Download and view the complete annual report
Please find page 31 of the 2009 Kraft annual report below. You can navigate through the pages in the report by either clicking on the pages listed below, or by using the keyword search tool below to find specific information within the annual report.-
 1
1 -
2
-
3
-
4
-
5
-
6
-
7
-
8
-
9
-
10
-
11
-
12
-
13
-
14
-
15
-
16
-
17
-
18
-
19
-
20
-
 21
21 -
 22
22 -
 23
23 -
 24
24 -
 25
25 -
 26
26 -
 27
27 -
 28
28 -
 29
29 -
 30
30 -
 31
31 -
 32
32 -
 33
33 -
 34
34 -
 35
35 -
 36
36 -
 37
37 -
 38
38 -
 39
39 -
 40
40 -
 41
41 -
42
-
43
-
44
-
45
-
46
-
47
-
48
-
49
-
50
-
51
-
52
-
53
-
54
-
55
-
56
-
57
-
58
-
59
-
60
-
61
-
62
-
63
-
64
-
65
-
66
-
67
-
68
-
69
-
70
-
71
-
72
-
73
-
74
-
75
-
76
-
77
-
78
-
79
-
80
-
81
-
82
-
83
-
84
-
85
-
86
-
87
-
88
-
89
-
90
-
91
-
92
-
93
-
94
-
95
-
96
-
97
-
98
-
99
-
100
-
101
-
102
-
103
-
104
-
105
-
106
-
107
-
108
-
109
-
110
-
111
-
112
-
113
-
114
-
115
-
116
-
117
-
118
-
119
-
120
-
121
-
122
-
123
-
124
-
125
-
126
-
127
-
128
-
129
-
130
-
131
-
132
-
133
-
134
-
135
-
136
-
137
-
138
-
139
-
140
-
141
-
142
-
143
-
144
-
145
-
146
-
147
-
148
-
149
-
150
-
151
-
152
-
153
-
154
-
155
-
156
-
157
-
158
-
159
-
160
-
161
-
162
-
163
-
164
-
165
-
166
-
167
-
168
-
169
-
170
-
171
-
172
-
173
-
174
-
175
-
176
-
177
-
178
-
179
-
180
-
181
-
182
-
183
-
184
-
185
-
186
-
187
-
188
-
189
-
190
-
191
-
192
-
193
-
194
-
195
-
196
-
197
-
198
-
199
-
200
-
201
-
202
-
203
-
204
-
205
-
206
-
207
-
208
-
209
-
210
-
211
-
212
-
213
-
214
-
215
-
216
-
217
-
218
-
219
-
220
-
221
-
222
-
223
-
224
-
225
-
226
-
227
-
228
-
229
-
230
-
231
-
232
-
233
-
234
-
235
-
236
-
237
-
238
-
239
-
240
-
241
-
242
-
243
 |
 |

charges for legal matters it increased $280 million over the prior year. The net impact of losses on divestitures and asset impairments had an
unfavorable impact of $126 million on operating income versus the prior year. The charges for legal matters related to certain of our U.S. and
European operations, including U.S. coffee operations. Charges for legal matters were recorded within marketing, administration and research
costs. In addition, foreign currency increased operating income by $61 million, due primarily to the strength of the Brazilian real, euro, Polish zloty
and Canadian dollar against the U.S. dollar.
As a result of these changes, operating margin also decreased from 11.6% in 2007 to 9.2% in 2008.
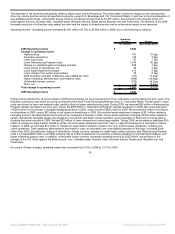
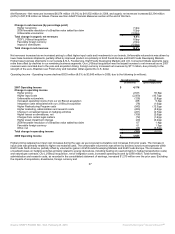
Net Earnings and Earnings per Share Attributable to Kraft Foods - Net earnings attributable to Kraft Foods of $2,884 million increased by $163
million (6.0%) in 2008. Diluted EPS from continuing operations attributable to Kraft Foods were $1.21 in 2008, down 22.4% from $1.56 in 2007.
Diluted EPS attributable to Kraft Foods were $1.90, up 11.8% from $1.70 in 2007, due to the following:
Net Earnings Diluted EPS
(in millions, except
per share data)
2007 Net Earnings Attributable to Kraft Foods $ 2,721 $ 1.70
Change in net earnings attributable to Kraft Foods
Increases in operations 0.03
Impact to operations from our LU Biscuit acquisition 0.15
Higher Restructuring Program costs (0.26)
Change in unrealized losses on hedging activities (0.09)
Higher asset impairment charges (0.04)
Higher losses on divestitures, net (0.04)
Charges from certain legal matters (0.03)
2008 favorable resolution of a Brazilian value added tax claim 0.03
Higher interest and other expense, net (0.23)
2007 interest from Altria tax reserve (0.03)
Favorable foreign currency 0.02
Deferred tax reconciliation 0.01
Other changes in taxes 0.03
Fewer shares outstanding 0.10
Change in net earnings from continuing operations (0.35)
2008 gain on the split-off of our Post cereals business 0.61
Decreased earnings from discontinued operations (0.06)
Change in net earnings from discontinued operations 0.55
Total change in net earnings attributable to Kraft Foods 163 0.20
2008 Net Earnings Attributable to Kraft Foods $ 2,884 $ 1.90
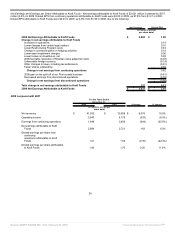
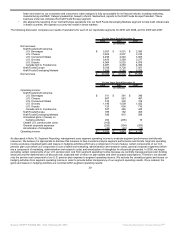
Results of Operations by Business Segment
We manage and report operating results through three geographic units, Kraft Foods North America, Kraft Foods Europe and Kraft Foods
Developing Markets. We manage the operations of Kraft Foods North America and Kraft Foods Europe by product category, and we manage the
operations of Kraft Foods Developing Markets by location. Our reportable segments are U.S. Beverages, U.S. Cheese, U.S. Convenient Meals,
U.S. Grocery, U.S. Snacks, Canada & N.A. Foodservice, Kraft Foods Europe (formerly known as European Union) and Kraft Foods Developing
Markets.
Effective January 2009, we began implementing changes to our operating structure based on our Organizing For Growth initiative and the Kraft
Foods Europe Reorganization. In line with our strategies, we are reorganizing our European operations to function on a pan-European centralized
category management and value chain model, and we changed how we work in Europe in two key ways:
• We transitioned our European Biscuit, Chocolate, Coffee and Cheese categories to fully integrated business units, further
strengthening our focus on these core categories. To ensure decisions are made
28
Source: KRAFT FOODS INC, 10-K, February 25, 2010 Powered by Morningstar® Document Research℠