Kraft 2009 Annual Report Download - page 25
Download and view the complete annual report
Please find page 25 of the 2009 Kraft annual report below. You can navigate through the pages in the report by either clicking on the pages listed below, or by using the keyword search tool below to find specific information within the annual report.-
 1
1 -
2
-
3
-
4
-
5
-
6
-
7
-
8
-
9
-
10
-
11
-
12
-
13
-
14
-
 15
15 -
 16
16 -
 17
17 -
 18
18 -
 19
19 -
 20
20 -
 21
21 -
 22
22 -
 23
23 -
 24
24 -
 25
25 -
 26
26 -
 27
27 -
 28
28 -
 29
29 -
 30
30 -
 31
31 -
 32
32 -
 33
33 -
 34
34 -
 35
35 -
36
-
37
-
38
-
39
-
40
-
41
-
42
-
43
-
44
-
45
-
46
-
47
-
48
-
49
-
50
-
51
-
52
-
53
-
54
-
55
-
56
-
57
-
58
-
59
-
60
-
61
-
62
-
63
-
64
-
65
-
66
-
67
-
68
-
69
-
70
-
71
-
72
-
73
-
74
-
75
-
76
-
77
-
78
-
79
-
80
-
81
-
82
-
83
-
84
-
85
-
86
-
87
-
88
-
89
-
90
-
91
-
92
-
93
-
94
-
95
-
96
-
97
-
98
-
99
-
100
-
101
-
102
-
103
-
104
-
105
-
106
-
107
-
108
-
109
-
110
-
111
-
112
-
113
-
114
-
115
-
116
-
117
-
118
-
119
-
120
-
121
-
122
-
123
-
124
-
125
-
126
-
127
-
128
-
129
-
130
-
131
-
132
-
133
-
134
-
135
-
136
-
137
-
138
-
139
-
140
-
141
-
142
-
143
-
144
-
145
-
146
-
147
-
148
-
149
-
150
-
151
-
152
-
153
-
154
-
155
-
156
-
157
-
158
-
159
-
160
-
161
-
162
-
163
-
164
-
165
-
166
-
167
-
168
-
169
-
170
-
171
-
172
-
173
-
174
-
175
-
176
-
177
-
178
-
179
-
180
-
181
-
182
-
183
-
184
-
185
-
186
-
187
-
188
-
189
-
190
-
191
-
192
-
193
-
194
-
195
-
196
-
197
-
198
-
199
-
200
-
201
-
202
-
203
-
204
-
205
-
206
-
207
-
208
-
209
-
210
-
211
-
212
-
213
-
214
-
215
-
216
-
217
-
218
-
219
-
220
-
221
-
222
-
223
-
224
-
225
-
226
-
227
-
228
-
229
-
230
-
231
-
232
-
233
-
234
-
235
-
236
-
237
-
238
-
239
-
240
-
241
-
242
-
243
 |
 |

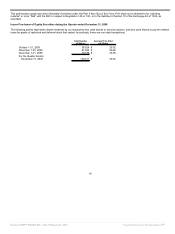
In 2008, we recorded aggregate asset impairment charges of $140 million, or $0.07 per diluted share. During our 2008 review of goodwill and
non-amortizable intangible assets, we recorded a $44 million charge for the impairment of intangible assets in the Netherlands, France and Puerto
Rico. In addition, in December 2008, we reached a preliminary agreement to divest a juice operation in Brazil and reached an agreement to sell a
cheese plant in Australia. In anticipation of divesting the juice operation in Brazil, we recorded an asset impairment charge of $13 million in the
fourth quarter of 2008. The charge primarily included the write-off of associated intangible assets of $8 million and property, plant and equipment
of $4 million. In anticipation of selling the cheese plant in Australia, we recorded an asset impairment charge of $28 million to property, plant and
equipment in the fourth quarter of 2008. Additionally, in 2008, we divested a Nordic and Baltic snacks operation, and incurred an asset impairment
charge of $55 million in connection with the divestiture. This charge primarily included the write-off of associated goodwill of $34 million and
property, plant and equipment of $16 million. We recorded the aggregate asset impairment charges within asset impairment and exit costs.
No impairments resulted from our 2007 annual review of goodwill and non-amortizable intangible assets. Additionally, in 2007, we divested our
flavored water and juice brand assets and related trademarks and incurred an asset impairment charge of $120 million, or $0.03 per diluted share,
in recognition of the divestiture. The charge primarily included the write-off of associated intangible assets of $70 million and property, plant and
equipment of $47 million and was recorded within asset impairment and exit costs.
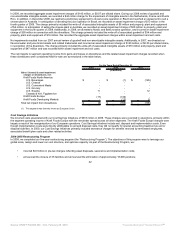
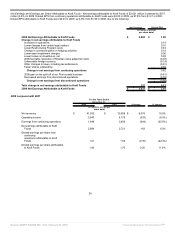
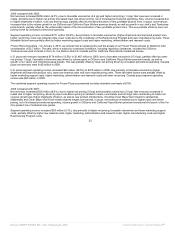
The net impacts to segment operating income from gains and losses on divestitures and the related asset impairment charges recorded when
these divestitures were considered held-for-sale are summarized in the table below.
For the Years Ended December 31,
2009 2008 2007
(in millions)
Gains / (losses) & asset impairment
charges on divestitures, net:
Kraft Foods North America:
U.S. Beverages $ - $ (1) $ (126)
U.S. Cheese - - -
U.S. Convenient Meals - - -
U.S. Grocery - - -
U.S. Snacks 11 - 12
Canada & N.A. Foodservice - - -
Kraft Foods Europe (1)
(17) (146) -
Kraft Foods Developing Markets - (13) 8
Total net impact from divestitures $ (6) $ (160) $ (106)
(1) This segment was formerly known as European Union.
Cost Savings Initiatives
We incurred costs associated with our Cost Savings Initiatives of $318 million in 2009. These charges were recorded in operations, primarily within
the segment operating income of Kraft Foods Europe with the remainder spread across all other segments. The Kraft Foods Europe charges were
largely a result of the reorganization of our European operations. Cost Savings Initiatives include exit, disposal and implementation costs. Even
though implementation costs were directly attributable to exit and disposal costs, they did not qualify for special accounting treatment as exit or
disposal activities. In 2009, our Cost Savings Initiatives primarily included severance charges for benefits received by terminated employees,
associated benefit plan costs and other related activities.
2004-2008 Restructuring Program
In 2008, we completed our five-year restructuring program (the “Restructuring Program”). The objectives of this program were to leverage our
global scale, realign and lower our cost structure, and optimize capacity. As part of the Restructuring Program, we:
• incurred $3.0 billion in pre-tax charges reflecting asset disposals, severance and implementation costs;
• announced the closure of 35 facilities and announced the elimination of approximately 18,600 positions;
22
Source: KRAFT FOODS INC, 10-K, February 25, 2010 Powered by Morningstar® Document Research℠