Kraft 2009 Annual Report Download - page 89
Download and view the complete annual report
Please find page 89 of the 2009 Kraft annual report below. You can navigate through the pages in the report by either clicking on the pages listed below, or by using the keyword search tool below to find specific information within the annual report.-
 1
1 -
2
-
3
-
4
-
5
-
6
-
7
-
8
-
9
-
10
-
11
-
12
-
13
-
14
-
15
-
16
-
17
-
18
-
19
-
20
-
21
-
22
-
23
-
24
-
25
-
26
-
27
-
28
-
29
-
30
-
31
-
32
-
33
-
34
-
35
-
36
-
37
-
38
-
39
-
40
-
41
-
42
-
43
-
44
-
45
-
46
-
47
-
48
-
49
-
50
-
51
-
52
-
53
-
54
-
55
-
56
-
57
-
58
-
59
-
60
-
61
-
62
-
63
-
64
-
65
-
66
-
67
-
68
-
69
-
70
-
71
-
72
-
73
-
74
-
75
-
76
-
77
-
78
-
 79
79 -
 80
80 -
 81
81 -
 82
82 -
 83
83 -
 84
84 -
 85
85 -
 86
86 -
 87
87 -
 88
88 -
 89
89 -
 90
90 -
 91
91 -
 92
92 -
 93
93 -
 94
94 -
 95
95 -
 96
96 -
 97
97 -
 98
98 -
 99
99 -
100
-
101
-
102
-
103
-
104
-
105
-
106
-
107
-
108
-
109
-
110
-
111
-
112
-
113
-
114
-
115
-
116
-
117
-
118
-
119
-
120
-
121
-
122
-
123
-
124
-
125
-
126
-
127
-
128
-
129
-
130
-
131
-
132
-
133
-
134
-
135
-
136
-
137
-
138
-
139
-
140
-
141
-
142
-
143
-
144
-
145
-
146
-
147
-
148
-
149
-
150
-
151
-
152
-
153
-
154
-
155
-
156
-
157
-
158
-
159
-
160
-
161
-
162
-
163
-
164
-
165
-
166
-
167
-
168
-
169
-
170
-
171
-
172
-
173
-
174
-
175
-
176
-
177
-
178
-
179
-
180
-
181
-
182
-
183
-
184
-
185
-
186
-
187
-
188
-
189
-
190
-
191
-
192
-
193
-
194
-
195
-
196
-
197
-
198
-
199
-
200
-
201
-
202
-
203
-
204
-
205
-
206
-
207
-
208
-
209
-
210
-
211
-
212
-
213
-
214
-
215
-
216
-
217
-
218
-
219
-
220
-
221
-
222
-
223
-
224
-
225
-
226
-
227
-
228
-
229
-
230
-
231
-
232
-
233
-
234
-
235
-
236
-
237
-
238
-
239
-
240
-
241
-
242
-
243
 |
 |

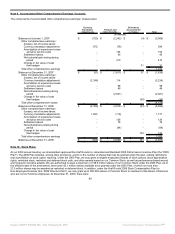
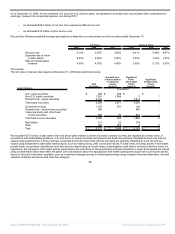
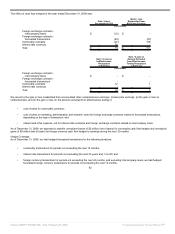
As of December 31, 2009, for the combined U.S. and non-U.S. pension plans, we expected to amortize from accumulated other comprehensive
earnings / (losses) into net periodic pension cost during 2010:
• an estimated $244 million of net loss from experience differences; and
• an estimated $12 million of prior service cost.
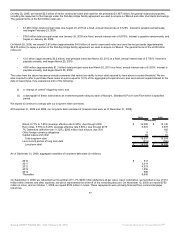
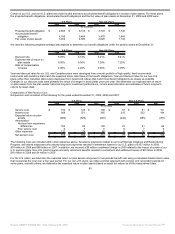
We used the following weighted-average assumptions to determine our net pension cost for the years ended December 31:
U.S. Plans Non-U.S. Plans
2009 2008 2007 2009 2008 2007
Discount rate 6.10% 6.30% 5.90% 6.41% 5.44%
4.67%
Expected rate of return
on plan assets 8.00% 8.00% 8.00% 7.25% 7.43% 7.53%
Rate of compensation
increase 4.00% 4.00% 4.00% 3.09% 3.13% 3.00%
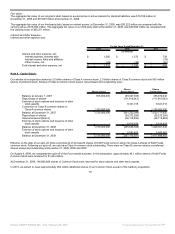
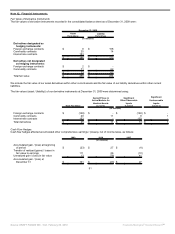
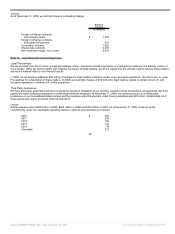
Plan Assets:
The fair value of pension plan assets at December 31, 2009 was determined using:
Asset Category
Total
Fair Value
Quoted Prices
in Active Market
for Identical
Assets
(Level 1)
Significant
Other
Observable
Inputs
(Level 2)
Significant
Unobservable
Inputs
(Level 3)
(in millions)
U.S. equity securities $ 289 $ 289 $ - $ -
Non-U.S. equity securities 1,991 1,988 2 1
Pooled funds - equity securities 3,014 - 3,014 -
Total equity securities 5,294 2,277 3,016 1
Government bonds 1,037 931 106 -
Pooled funds - fixed income securities 945 - 945 -
Corporate bonds and other fixed
income securities 988 54 932 2
Total fixed income securities 2,970 985 1,983 2
Real estate 131 22 109 -
Other 326 322 2 2
Total $ 8,721 $ 3,606 $ 5,110 $ 5
We excluded $172 million of plan assets from the above table related to certain insurance contracts as they are reported at contract value, in
accordance with authoritative guidance. U.S. and non-U.S. equity securities and government bonds are primarily classified as level one and are
valued using quoted prices in active markets. Corporate bonds and other fixed income securities are primarily classified as level two and are
valued using independent observable market inputs, such as matrix pricing, yield curves and indices. Pooled funds, including assets in real estate
pooled funds, are primarily classified as level two and are valued using net asset values of participation units held in common collective trusts, as
reported by the managers of the trusts and as supported by the unit prices of actual purchase and sale transactions. Level three assets are valued
using unobservable inputs that reflect the plans’ own assumptions about the assumptions that market participants would use in pricing the assets,
based on the best information available, such as investment manager pricing for limited partnerships using company financial statements, relevant
valuation multiples and discounted cash flow analyses.
86
Source: KRAFT FOODS INC, 10-K, February 25, 2010 Powered by Morningstar® Document Research℠