Kraft 2009 Annual Report Download - page 5
Download and view the complete annual report
Please find page 5 of the 2009 Kraft annual report below. You can navigate through the pages in the report by either clicking on the pages listed below, or by using the keyword search tool below to find specific information within the annual report.-
 1
1 -
 2
2 -
 3
3 -
 4
4 -
 5
5 -
 6
6 -
 7
7 -
 8
8 -
 9
9 -
 10
10 -
 11
11 -
 12
12 -
 13
13 -
 14
14 -
 15
15 -
 16
16 -
17
-
18
-
19
-
20
-
21
-
22
-
23
-
24
-
25
-
26
-
27
-
28
-
29
-
30
-
31
-
32
-
33
-
34
-
35
-
36
-
37
-
38
-
39
-
40
-
41
-
42
-
43
-
44
-
45
-
46
-
47
-
48
-
49
-
50
-
51
-
52
-
53
-
54
-
55
-
56
-
57
-
58
-
59
-
60
-
61
-
62
-
63
-
64
-
65
-
66
-
67
-
68
-
69
-
70
-
71
-
72
-
73
-
74
-
75
-
76
-
77
-
78
-
79
-
80
-
81
-
82
-
83
-
84
-
85
-
86
-
87
-
88
-
89
-
90
-
91
-
92
-
93
-
94
-
95
-
96
-
97
-
98
-
99
-
100
-
101
-
102
-
103
-
104
-
105
-
106
-
107
-
108
-
109
-
110
-
111
-
112
-
113
-
114
-
115
-
116
-
117
-
118
-
119
-
120
-
121
-
122
-
123
-
124
-
125
-
126
-
127
-
128
-
129
-
130
-
131
-
132
-
133
-
134
-
135
-
136
-
137
-
138
-
139
-
140
-
141
-
142
-
143
-
144
-
145
-
146
-
147
-
148
-
149
-
150
-
151
-
152
-
153
-
154
-
155
-
156
-
157
-
158
-
159
-
160
-
161
-
162
-
163
-
164
-
165
-
166
-
167
-
168
-
169
-
170
-
171
-
172
-
173
-
174
-
175
-
176
-
177
-
178
-
179
-
180
-
181
-
182
-
183
-
184
-
185
-
186
-
187
-
188
-
189
-
190
-
191
-
192
-
193
-
194
-
195
-
196
-
197
-
198
-
199
-
200
-
201
-
202
-
203
-
204
-
205
-
206
-
207
-
208
-
209
-
210
-
211
-
212
-
213
-
214
-
215
-
216
-
217
-
218
-
219
-
220
-
221
-
222
-
223
-
224
-
225
-
226
-
227
-
228
-
229
-
230
-
231
-
232
-
233
-
234
-
235
-
236
-
237
-
238
-
239
-
240
-
241
-
242
-
243
 |
 |

operating income to evaluate segment performance and allocate resources. We believe it is appropriate to disclose this measure to help investors
analyze segment performance and trends. Segment operating income excludes unrealized gains and losses on hedging activities (which are a
component of cost of sales), certain components of our U.S. pension plan cost (which is a component of cost of sales and marketing,
administration and research costs), general corporate expenses (which are a component of marketing, administration and research costs) and
amortization of intangibles.
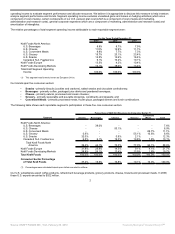
The relative percentages of total segment operating income attributable to each reportable segment were:
For the Years Ended December 31,
2009 2008 2007
Kraft Foods North America:
U.S. Beverages 8.8% 8.7% 7.9%
U.S. Cheese 11.5% 12.9% 11.1%
U.S. Convenient Meals 8.8% 7.7% 7.3%
U.S. Grocery 19.7% 23.1% 23.4%
U.S. Snacks 12.5% 14.6% 16.4%
Canada & N.A. Foodservice 9.1% 10.2% 10.1%
Kraft Foods Europe (1)
13.5% 4.2% 10.4%
Kraft Foods Developing Markets 16.1% 18.6% 13.4%
Total Kraft Segment Operating
Income 100.0% 100.0% 100.0%
(1) This segment was formerly known as European Union.
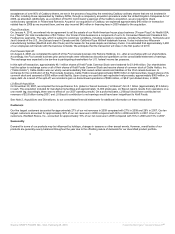
Our brands span five consumer sectors:
• Snacks - primarily biscuits (cookies and crackers), salted snacks and chocolate confectionery;
• Beverages - primarily coffee, packaged juice drinks and powdered beverages;
• Cheese - primarily natural, processed and cream cheeses;
• Grocery - primarily spoonable and pourable dressings, condiments and desserts; and
• Convenient Meals - primarily processed meats, frozen pizza, packaged dinners and lunch combinations.
The following table shows each reportable segment’s participation in these five core consumer sectors.
Percentage of 2009 Net Revenues by Consumer Sector (1)
Segment Snacks Beverages Cheese Grocery
Convenient
Meals Total
Kraft Foods North America:
U.S. Beverages - 38.0% - - - 7.6%
U.S. Cheese - - 53.1% - - 8.9%
U.S. Convenient Meals - - - - 69.7% 11.1%
U.S. Grocery 0.9% - - 55.1% 16.6% 8.6%
U.S. Snacks 32.0% - 0.9% 2.1% - 12.3%
Canada & N.A. Foodservice 6.5% 6.1% 19.3% 19.8% 7.8% 10.1%
Total Kraft Foods North
America 39.4% 44.1% 73.3% 77.0% 94.1% 58.6%
Kraft Foods Europe 31.8% 29.8% 14.3% 9.1% 4.1% 21.7%
Kraft Foods Developing Markets 28.8% 26.1% 12.4% 13.9% 1.8% 19.7%
Total Kraft Foods 100.0% 100.0% 100.0% 100.0% 100.0% 100.0%
Consumer Sector Percentage
of Total Kraft Foods 37.2% 19.9% 16.8% 10.1% 16.0% 100.0%
(1) Percentages were calculated based upon dollars rounded to millions.
Our U.S. subsidiaries export coffee products, refreshment beverage products, grocery products, cheese, biscuits and processed meats. In 2009,
these U.S. exports amounted to $522 million.
2
Source: KRAFT FOODS INC, 10-K, February 25, 2010 Powered by Morningstar® Document Research℠