Kraft 2009 Annual Report Download - page 210
Download and view the complete annual report
Please find page 210 of the 2009 Kraft annual report below. You can navigate through the pages in the report by either clicking on the pages listed below, or by using the keyword search tool below to find specific information within the annual report.-
 1
1 -
2
-
3
-
4
-
5
-
6
-
7
-
8
-
9
-
10
-
11
-
12
-
13
-
14
-
15
-
16
-
17
-
18
-
19
-
20
-
21
-
22
-
23
-
24
-
25
-
26
-
27
-
28
-
29
-
30
-
31
-
32
-
33
-
34
-
35
-
36
-
37
-
38
-
39
-
40
-
41
-
42
-
43
-
44
-
45
-
46
-
47
-
48
-
49
-
50
-
51
-
52
-
53
-
54
-
55
-
56
-
57
-
58
-
59
-
60
-
61
-
62
-
63
-
64
-
65
-
66
-
67
-
68
-
69
-
70
-
71
-
72
-
73
-
74
-
75
-
76
-
77
-
78
-
79
-
80
-
81
-
82
-
83
-
84
-
85
-
86
-
87
-
88
-
89
-
90
-
91
-
92
-
93
-
94
-
95
-
96
-
97
-
98
-
99
-
100
-
101
-
102
-
103
-
104
-
105
-
106
-
107
-
108
-
109
-
110
-
111
-
112
-
113
-
114
-
115
-
116
-
117
-
118
-
119
-
120
-
121
-
122
-
123
-
124
-
125
-
126
-
127
-
128
-
129
-
130
-
131
-
132
-
133
-
134
-
135
-
136
-
137
-
138
-
139
-
140
-
141
-
142
-
143
-
144
-
145
-
146
-
147
-
148
-
149
-
150
-
151
-
152
-
153
-
154
-
155
-
156
-
157
-
158
-
159
-
160
-
161
-
162
-
163
-
164
-
165
-
166
-
167
-
168
-
169
-
170
-
171
-
172
-
173
-
174
-
175
-
176
-
177
-
178
-
179
-
180
-
181
-
182
-
183
-
184
-
185
-
186
-
187
-
188
-
189
-
190
-
191
-
192
-
193
-
194
-
195
-
196
-
197
-
198
-
199
-
 200
200 -
 201
201 -
 202
202 -
 203
203 -
 204
204 -
 205
205 -
 206
206 -
 207
207 -
 208
208 -
 209
209 -
 210
210 -
 211
211 -
 212
212 -
 213
213 -
 214
214 -
 215
215 -
 216
216 -
 217
217 -
 218
218 -
 219
219 -
 220
220 -
221
-
222
-
223
-
224
-
225
-
226
-
227
-
228
-
229
-
230
-
231
-
232
-
233
-
234
-
235
-
236
-
237
-
238
-
239
-
240
-
241
-
242
-
243
 |
 |

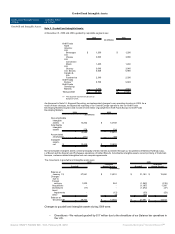
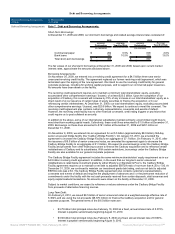
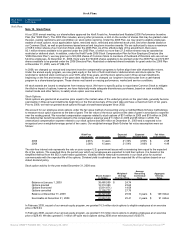
Restructuring Costs:
Under the Restructuring Program, we recorded asset impairment and exit costs of $884 million during 2008 and $332 million
during 2007. Restructuring liability activity for the years ended December 31, 2009 and 2008 was:
Severance
Asset
Write-downs Other Total
(in millions)
Liability balance, January 1, 2008 $ 154 $ - $ 16 $ 170
Charges 590 195 99 884
Cash (spent) / received (255) 33 (71) (293)
Charges against assets (30) (214) 2 (242)
Currency (15) (14) (1) (30)
Liability balance, December 31, 2008 444 - 45 489
Reversal of charges (77) (4) (4) (85)
Cash (spent) / received (162) 1 (15) (176)
Currency 40 3 (1) 42
Liability balance, December 31, 2009 $ 245 $ - $ 25 $ 270
Our 2009 activity was related to the aforementioned reversal of $85 million and cash outflows on prior year Restructuring
Program charges. Our prior year severance charges included the cost of benefits received by terminated employees.
Severance charges against assets primarily related to incremental pension costs, which reduced prepaid pension assets.
Asset impairment write-downs were caused by plant closings and related activity. Cash received on asset write-downs
reflected the higher than anticipated net proceeds from the sales of assets previously written-down under the Restructuring
Program. Other prior year costs related primarily to the renegotiation of supplier contract costs, workforce reductions
associated with facility closings and the termination of leasing agreements.
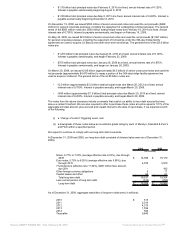
Implementation Costs:
Implementation costs were directly attributable to exit and disposal costs; however, they did not qualify for special accounting
treatment as exit or disposal activities. These costs primarily included the discontinuance of certain product lines, incremental
expenses related to the closure of facilities and the reorganization of our European operations discussed above.
Management believes the disclosure of implementation charges provides readers of our financial statements greater
transparency to the total costs of our Restructuring Program.
Implementation costs associated with the Restructuring Program were:
2008 2007
(in millions)
Cost of sales $ 38 $ 67
Marketing, administration and
research costs 67 60
Total implementation costs $ 105 $ 127
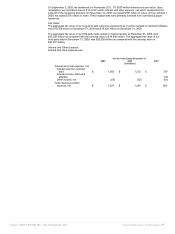
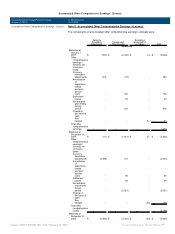
Total Restructuring Program Costs:
We included the asset impairment, exit and implementation costs discussed above, for the years ended December 31, 2008
and 2007 in segment operating income as follows:
For the Year Ended December 31, 2008
Restructuring
Costs
Implementation
Costs Total
(in millions)
Kraft Foods North America:
U.S. Beverages $ 59 $ 8 $ 67
U.S. Cheese 31 7 38
U.S. Convenient Meals 31 7 38
U.S. Grocery 36 5 41
U.S. Snacks 72 9 81
Canada & N.A. Foodservice 100 10 110
Kraft Foods Europe 418 56 474
Kraft Foods Developing Markets 137 3 140
Total - continuing operations 884 105 989
Discontinued operations - - -
Total $ 884 $ 105 $ 989
For the Year Ended December 31, 2007
Restructuring
Costs
Implementation
Costs Total
(in millions)
Kraft North America:
U.S. Beverages $ 12 $ 7 $ 19
U.S. Cheese 50 25 75
U.S. Convenient Meals 20 15 35
Source: KRAFT FOODS INC, 10-K, February 25, 2010 Powered by Morningstar® Document Research℠