Kraft 2009 Annual Report Download - page 107
Download and view the complete annual report
Please find page 107 of the 2009 Kraft annual report below. You can navigate through the pages in the report by either clicking on the pages listed below, or by using the keyword search tool below to find specific information within the annual report.-
 1
1 -
2
-
3
-
4
-
5
-
6
-
7
-
8
-
9
-
10
-
11
-
12
-
13
-
14
-
15
-
16
-
17
-
18
-
19
-
20
-
21
-
22
-
23
-
24
-
25
-
26
-
27
-
28
-
29
-
30
-
31
-
32
-
33
-
34
-
35
-
36
-
37
-
38
-
39
-
40
-
41
-
42
-
43
-
44
-
45
-
46
-
47
-
48
-
49
-
50
-
51
-
52
-
53
-
54
-
55
-
56
-
57
-
58
-
59
-
60
-
61
-
62
-
63
-
64
-
65
-
66
-
67
-
68
-
69
-
70
-
71
-
72
-
73
-
74
-
75
-
76
-
77
-
78
-
79
-
80
-
81
-
82
-
83
-
84
-
85
-
86
-
87
-
88
-
89
-
90
-
91
-
92
-
93
-
94
-
95
-
96
-
 97
97 -
 98
98 -
 99
99 -
 100
100 -
 101
101 -
 102
102 -
 103
103 -
 104
104 -
 105
105 -
 106
106 -
 107
107 -
 108
108 -
 109
109 -
 110
110 -
 111
111 -
 112
112 -
 113
113 -
 114
114 -
 115
115 -
 116
116 -
 117
117 -
118
-
119
-
120
-
121
-
122
-
123
-
124
-
125
-
126
-
127
-
128
-
129
-
130
-
131
-
132
-
133
-
134
-
135
-
136
-
137
-
138
-
139
-
140
-
141
-
142
-
143
-
144
-
145
-
146
-
147
-
148
-
149
-
150
-
151
-
152
-
153
-
154
-
155
-
156
-
157
-
158
-
159
-
160
-
161
-
162
-
163
-
164
-
165
-
166
-
167
-
168
-
169
-
170
-
171
-
172
-
173
-
174
-
175
-
176
-
177
-
178
-
179
-
180
-
181
-
182
-
183
-
184
-
185
-
186
-
187
-
188
-
189
-
190
-
191
-
192
-
193
-
194
-
195
-
196
-
197
-
198
-
199
-
200
-
201
-
202
-
203
-
204
-
205
-
206
-
207
-
208
-
209
-
210
-
211
-
212
-
213
-
214
-
215
-
216
-
217
-
218
-
219
-
220
-
221
-
222
-
223
-
224
-
225
-
226
-
227
-
228
-
229
-
230
-
231
-
232
-
233
-
234
-
235
-
236
-
237
-
238
-
239
-
240
-
241
-
242
-
243
 |
 |

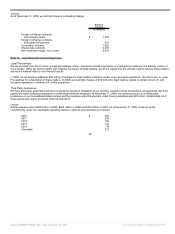
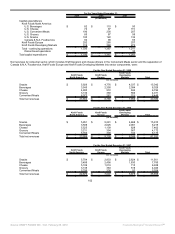
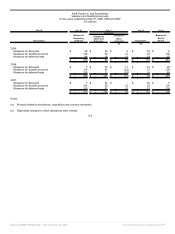
During 2009, we recorded the following pre-tax charges / (gains) in earnings from continuing operations:
2009 Quarters
First Second Third Fourth
(in millions)
Asset impairment and exit costs $ - $ (26) $ - $ (38)
(Gains) / losses on divestitures, net - 17 - (11)
$ - $ (9) $ - $ (49)
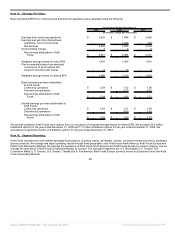
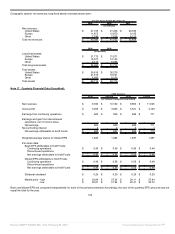
2008 Quarters
First Second Third Fourth
(in millions, except per share data)
Net revenues $ 10,046 $ 10,804 $ 10,401 $ 10,681
Gross profit $ 3,301 $ 3,868 $ 3,305 $ 3,370
Earnings from continuing operations $ 547 $ 678 $ 520 $ 103
Earnings and gain from discontinued
operations, net of income taxes 54 69 845 77
Net earnings 601 747 1,365 180
Noncontrolling interest 2 2 3 2
Net earnings attributable to Kraft Foods $ 599 $ 745 $ 1,362 $ 178
Weighted-average shares for diluted EPS 1,542 1,532 1,503 1,481
Per share data:
Basic EPS attributable to Kraft Foods:
Continuing operations $ 0.35 $ 0.44 $ 0.34 $ 0.07
Discontinued operations 0.04 0.05 0.57 0.05
Net earnings attributable to Kraft Foods $ 0.39 $ 0.49 $ 0.91 $ 0.12
Diluted EPS attributable to Kraft Foods:
Continuing operations $ 0.35 $ 0.44 $ 0.34 $ 0.07
Discontinued operations 0.04 0.05 0.57 0.05
Net earnings attributable to Kraft Foods $ 0.39 $ 0.49 $ 0.91 $ 0.12
Dividends declared $ 0.27 $ 0.27 $ 0.29 $ 0.29
Market price - high $ 32.85 $ 32.99 $ 34.97 $ 34.05
Market price - low $ 28.63 $ 28.33 $ 28.04 $ 24.75
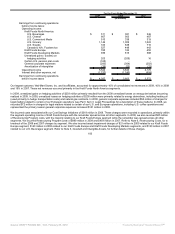
Basic and diluted EPS are computed independently for each of the periods presented. Accordingly, the sum of the quarterly EPS amounts may not
equal the total for the year.
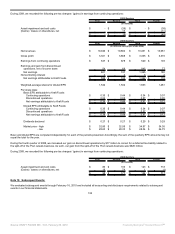
During the fourth quarter of 2008, we increased our gain on discontinued operations by $77 million to correct for a deferred tax liability related to
the split-off of the Post cereals business. As such, our gain from the split-off of the Post cereals business was $926 million.
During 2008, we recorded the following pre-tax charges / (gains) in earnings from continuing operations:
2008 Quarters
First Second Third Fourth
(in millions)
Asset impairment and exit costs $ 80 $ 103 $ 123 $ 718
(Gains) / losses on divestitures, net 18 74 1 (1)
$ 98 $ 177 $ 124 $ 717
Note 18. Subsequent Events:
We evaluated subsequent events through February 16, 2010 and included all accounting and disclosure requirements related to subsequent
events in our financial statements.
104
Source: KRAFT FOODS INC, 10-K, February 25, 2010 Powered by Morningstar® Document Research℠