Kraft 2009 Annual Report Download - page 39
Download and view the complete annual report
Please find page 39 of the 2009 Kraft annual report below. You can navigate through the pages in the report by either clicking on the pages listed below, or by using the keyword search tool below to find specific information within the annual report.-
 1
1 -
2
-
3
-
4
-
5
-
6
-
7
-
8
-
9
-
10
-
11
-
12
-
13
-
14
-
15
-
16
-
17
-
18
-
19
-
20
-
21
-
22
-
23
-
24
-
25
-
26
-
27
-
28
-
 29
29 -
 30
30 -
 31
31 -
 32
32 -
 33
33 -
 34
34 -
 35
35 -
 36
36 -
 37
37 -
 38
38 -
 39
39 -
 40
40 -
 41
41 -
 42
42 -
 43
43 -
 44
44 -
 45
45 -
 46
46 -
 47
47 -
 48
48 -
 49
49 -
50
-
51
-
52
-
53
-
54
-
55
-
56
-
57
-
58
-
59
-
60
-
61
-
62
-
63
-
64
-
65
-
66
-
67
-
68
-
69
-
70
-
71
-
72
-
73
-
74
-
75
-
76
-
77
-
78
-
79
-
80
-
81
-
82
-
83
-
84
-
85
-
86
-
87
-
88
-
89
-
90
-
91
-
92
-
93
-
94
-
95
-
96
-
97
-
98
-
99
-
100
-
101
-
102
-
103
-
104
-
105
-
106
-
107
-
108
-
109
-
110
-
111
-
112
-
113
-
114
-
115
-
116
-
117
-
118
-
119
-
120
-
121
-
122
-
123
-
124
-
125
-
126
-
127
-
128
-
129
-
130
-
131
-
132
-
133
-
134
-
135
-
136
-
137
-
138
-
139
-
140
-
141
-
142
-
143
-
144
-
145
-
146
-
147
-
148
-
149
-
150
-
151
-
152
-
153
-
154
-
155
-
156
-
157
-
158
-
159
-
160
-
161
-
162
-
163
-
164
-
165
-
166
-
167
-
168
-
169
-
170
-
171
-
172
-
173
-
174
-
175
-
176
-
177
-
178
-
179
-
180
-
181
-
182
-
183
-
184
-
185
-
186
-
187
-
188
-
189
-
190
-
191
-
192
-
193
-
194
-
195
-
196
-
197
-
198
-
199
-
200
-
201
-
202
-
203
-
204
-
205
-
206
-
207
-
208
-
209
-
210
-
211
-
212
-
213
-
214
-
215
-
216
-
217
-
218
-
219
-
220
-
221
-
222
-
223
-
224
-
225
-
226
-
227
-
228
-
229
-
230
-
231
-
232
-
233
-
234
-
235
-
236
-
237
-
238
-
239
-
240
-
241
-
242
-
243
 |
 |

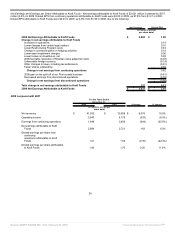
variances were partially offset by higher net pricing, the impact of our LU Biscuit acquisition (net of associated integration costs), lower
manufacturing costs, lower marketing support costs and favorable volume/mix (improved mix, net of lower shipments).
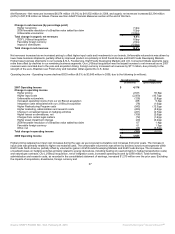
Kraft Foods Europe Reorganization - The reorganization of our European operations to function on a pan-European centralized category
management and value chain model was completed in 2009 for our Chocolate, Coffee and Cheese categories. Significant progress was made in
2009 related to the integration of our Europe Biscuits business, and we expect the integration to be completed by mid-2010. The European
Principal Company (“EPC”) will manage the European categories centrally and make decisions for all aspects of the value chain, except for sales
and distribution. The European subsidiaries will execute sales and distribution locally, and the local production companies will act as toll
manufacturers on behalf of the EPC. The EPC legal entity has been incorporated as Kraft Foods Europe GmbH in Zurich, Switzerland. As part of
the reorganization, we incurred $32 million of severance costs, $25 million of implementation costs and $56 million of other non-recurring costs
during 2009; we incurred $16 million of restructuring costs, $39 million of implementation costs and $11 million of other non-recurring costs during
2008; and we incurred $21 million of restructuring costs, $24 million of implementation costs and $10 million of other non-recurring costs during
2007. Through 2009, we have incurred charges of $241 million related to our Kraft Foods Europe Reorganization, including the above mentioned
costs. We expect to incur approximately $40 million in additional charges in 2010 to complete the integration of the Europe Biscuits business. In
2009, these charges were recorded within cost of sales and marketing, administration and research costs. The 2008 and 2007 restructuring and
implementation costs were recorded as part of our overall Restructuring Program. Other non-recurring costs relating to our Kraft Foods Europe
Reorganization were recorded as marketing, administration and research costs. Management believes the disclosure of implementation and other
non-recurring charges provides readers of our financial statements greater transparency to the total costs of our Kraft Foods Europe
Reorganization.
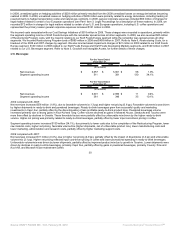
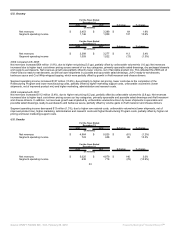
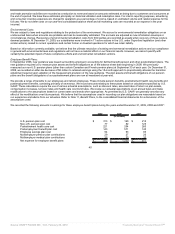
Kraft Foods Developing Markets
For the Years Ended
December 31,
2009 2008 $ change % change
(in millions)
Net revenues $ 7,956 $ 8,248 $ (292) (3.5%)
Segment operating income 936 815 121 14.8%
For the Years Ended
December 31,
2008 2007 $ change % change
(in millions)
Net revenues $ 8,248 $ 5,975 $ 2,273 38.0%
Segment operating income 815 588 227 38.6%
2009 compared with 2008:
Net revenues decreased $292 million (3.5%), due to the significant impact of unfavorable foreign currency (12.9 pp), the absence of the 2008
favorable resolution of a Brazilian value added tax claim (0.8 pp) and the impact of divestitures (0.5 pp), partially offset by higher net pricing (8.9
pp) and favorable volume/mix (1.8 pp). In Central and Eastern Europe, Middle East and Africa, net revenues decreased, driven primarily by
unfavorable foreign currency, partially offset by higher net pricing across most of the region and favorable volume/mix (improved product mix, net
of lower shipments). In Latin America, net revenues increased, primarily driven by higher net pricing across the region and favorable volume/mix
(lower shipments, net of improved product mix), partially offset by unfavorable foreign currency and the absence of the 2008 favorable resolution
of a Brazilian value added tax claim. In Asia Pacific, net revenues increased, due to higher net pricing across most of the region and favorable
volume/mix (improved product mix, net of lower shipments), primarily in China, partially offset by unfavorable foreign currency.
Segment operating income increased $121 million (14.8%), due primarily to higher net pricing, favorable volume/mix (improved product mix, net of
lower shipments), lower costs due to the completion of the Restructuring Program (including the reversal of prior year costs) and 2008 asset
impairment charges related to certain international intangible assets, a juice operation in Brazil and a cheese plant in Australia. These favorable
variances were partially offset by higher raw material costs, higher manufacturing costs, unfavorable foreign currency, higher marketing,
administration and research costs, higher marketing support costs and the absence of the 2008 favorable resolution of a Brazilian value added tax
claim.
36
Source: KRAFT FOODS INC, 10-K, February 25, 2010 Powered by Morningstar® Document Research℠