Kraft 2009 Annual Report Download - page 65
Download and view the complete annual report
Please find page 65 of the 2009 Kraft annual report below. You can navigate through the pages in the report by either clicking on the pages listed below, or by using the keyword search tool below to find specific information within the annual report.-
 1
1 -
2
-
3
-
4
-
5
-
6
-
7
-
8
-
9
-
10
-
11
-
12
-
13
-
14
-
15
-
16
-
17
-
18
-
19
-
20
-
21
-
22
-
23
-
24
-
25
-
26
-
27
-
28
-
29
-
30
-
31
-
32
-
33
-
34
-
35
-
36
-
37
-
38
-
39
-
40
-
41
-
42
-
43
-
44
-
45
-
46
-
47
-
48
-
49
-
50
-
51
-
52
-
53
-
54
-
 55
55 -
 56
56 -
 57
57 -
 58
58 -
 59
59 -
 60
60 -
 61
61 -
 62
62 -
 63
63 -
 64
64 -
 65
65 -
 66
66 -
 67
67 -
 68
68 -
 69
69 -
 70
70 -
 71
71 -
 72
72 -
 73
73 -
 74
74 -
 75
75 -
76
-
77
-
78
-
79
-
80
-
81
-
82
-
83
-
84
-
85
-
86
-
87
-
88
-
89
-
90
-
91
-
92
-
93
-
94
-
95
-
96
-
97
-
98
-
99
-
100
-
101
-
102
-
103
-
104
-
105
-
106
-
107
-
108
-
109
-
110
-
111
-
112
-
113
-
114
-
115
-
116
-
117
-
118
-
119
-
120
-
121
-
122
-
123
-
124
-
125
-
126
-
127
-
128
-
129
-
130
-
131
-
132
-
133
-
134
-
135
-
136
-
137
-
138
-
139
-
140
-
141
-
142
-
143
-
144
-
145
-
146
-
147
-
148
-
149
-
150
-
151
-
152
-
153
-
154
-
155
-
156
-
157
-
158
-
159
-
160
-
161
-
162
-
163
-
164
-
165
-
166
-
167
-
168
-
169
-
170
-
171
-
172
-
173
-
174
-
175
-
176
-
177
-
178
-
179
-
180
-
181
-
182
-
183
-
184
-
185
-
186
-
187
-
188
-
189
-
190
-
191
-
192
-
193
-
194
-
195
-
196
-
197
-
198
-
199
-
200
-
201
-
202
-
203
-
204
-
205
-
206
-
207
-
208
-
209
-
210
-
211
-
212
-
213
-
214
-
215
-
216
-
217
-
218
-
219
-
220
-
221
-
222
-
223
-
224
-
225
-
226
-
227
-
228
-
229
-
230
-
231
-
232
-
233
-
234
-
235
-
236
-
237
-
238
-
239
-
240
-
241
-
242
-
243
 |
 |

Software Costs:
We capitalize certain computer software and software development costs incurred in connection with developing or obtaining computer software
for internal use. Capitalized software costs are included in property, plant and equipment and amortized on a straight-line basis over the estimated
useful lives of the software, which do not exceed seven years.
Goodwill and Intangible Assets:
We test goodwill and non-amortizable intangible assets at least annually for impairment. We have recognized goodwill in our reporting units, which
are generally one level below our operating segments. We use a two step process to test goodwill at the reporting unit level. The first step involves
a comparison of the estimated fair value of each reporting unit with its carrying value. Fair value is estimated using discounted cash flows of the
reporting unit based on planned growth rates, and estimates of discount rates and residual values. If the carrying value exceeds the fair value, the
second step of the process is necessary. The second step measures the difference between the carrying value and implied fair value of goodwill.
To test non-amortizable intangible assets for impairment, we compare the fair value of the intangible asset with its carrying value. Fair value of
non-amortizable intangible assets is determined using our planned growth rates, and estimates of discount rates and royalty rates. If the carrying
value exceeds fair value, the intangible asset is considered impaired and is reduced to fair value. Definite-lived intangible assets are amortized
over their estimated useful lives.
We perform our annual impairment review of goodwill and non-amortizable intangible assets as of October 1 each year. The basis of our valuation
methodology for estimating the fair value of our 20 reporting units is a 20-year projection of discounted cash flows that is based on our annual
strategic planning process. Estimating the fair value of individual reporting units requires us to make assumptions and estimates regarding our
future plans, industry and economic conditions. For our reporting units within our Kraft Foods North America and Kraft Foods Europe geographic
units, we used a market-participant, weighted-average cost of capital of 7.5% to discount the projected cash flows of those operations. For our
reporting units within our Kraft Foods Developing Markets geographic unit, we used a risk-rated discount rate of 10.5%.
Insurance and Self-Insurance:
We use a combination of insurance and self-insurance for a number of risks, including workers’ compensation, general liability, automobile liability,
product liability and our obligation for employee healthcare benefits. Liabilities associated with the risks are estimated by considering historical
claims experience and other actuarial assumptions.
Revenue Recognition:
We recognize revenues when title and risk of loss pass to customers, which generally occurs upon shipment or delivery of goods. Revenues are
recorded net of consumer incentives and trade promotions and include all shipping and handling charges billed to customers. Kraft Foods’
shipping and handling costs are classified as part of cost of sales. A provision for product returns and allowances for bad debts are also recorded
as reductions to revenues within the same period that the revenue is recognized.
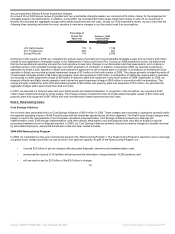
Excise Taxes:
Effective January 1, 2009, we changed our classification of certain excise taxes to a net presentation within cost of sales. In prior years, excise
taxes were classified gross within net revenues and cost of sales. With this change, we report all of our excise and similar taxes using the net
presentation method. We made this change to better align our net revenues between various countries and to provide better clarity to net
revenues and margins. As a result, we removed $269 million in 2008 and $276 million in 2007 from net revenues, and netted the amounts within
cost of sales. If we had not made this change, in 2009, net revenues of $40,386 million would have been $40,621 million, and cost of sales of
$25,786 million would have been $26,021 million. This change did not have a material impact on our net revenues or cost of sales.
Marketing, Administration and Research Costs:
Marketing - We promote our products with advertising, consumer incentives and trade promotions. These programs include, but are not limited to,
discounts, coupons, rebates, in-store display incentives and volume-based incentives. We expense advertising costs either in the period the
advertising first takes place or as incurred. Consumer incentive and trade promotion activities are recorded as a reduction to revenues based on
amounts estimated as being due to customers and consumers at the end of a period. We base these estimates principally on historical
62
Source: KRAFT FOODS INC, 10-K, February 25, 2010 Powered by Morningstar® Document Research℠