Kraft 2009 Annual Report Download - page 233
Download and view the complete annual report
Please find page 233 of the 2009 Kraft annual report below. You can navigate through the pages in the report by either clicking on the pages listed below, or by using the keyword search tool below to find specific information within the annual report.-
 1
1 -
2
-
3
-
4
-
5
-
6
-
7
-
8
-
9
-
10
-
11
-
12
-
13
-
14
-
15
-
16
-
17
-
18
-
19
-
20
-
21
-
22
-
23
-
24
-
25
-
26
-
27
-
28
-
29
-
30
-
31
-
32
-
33
-
34
-
35
-
36
-
37
-
38
-
39
-
40
-
41
-
42
-
43
-
44
-
45
-
46
-
47
-
48
-
49
-
50
-
51
-
52
-
53
-
54
-
55
-
56
-
57
-
58
-
59
-
60
-
61
-
62
-
63
-
64
-
65
-
66
-
67
-
68
-
69
-
70
-
71
-
72
-
73
-
74
-
75
-
76
-
77
-
78
-
79
-
80
-
81
-
82
-
83
-
84
-
85
-
86
-
87
-
88
-
89
-
90
-
91
-
92
-
93
-
94
-
95
-
96
-
97
-
98
-
99
-
100
-
101
-
102
-
103
-
104
-
105
-
106
-
107
-
108
-
109
-
110
-
111
-
112
-
113
-
114
-
115
-
116
-
117
-
118
-
119
-
120
-
121
-
122
-
123
-
124
-
125
-
126
-
127
-
128
-
129
-
130
-
131
-
132
-
133
-
134
-
135
-
136
-
137
-
138
-
139
-
140
-
141
-
142
-
143
-
144
-
145
-
146
-
147
-
148
-
149
-
150
-
151
-
152
-
153
-
154
-
155
-
156
-
157
-
158
-
159
-
160
-
161
-
162
-
163
-
164
-
165
-
166
-
167
-
168
-
169
-
170
-
171
-
172
-
173
-
174
-
175
-
176
-
177
-
178
-
179
-
180
-
181
-
182
-
183
-
184
-
185
-
186
-
187
-
188
-
189
-
190
-
191
-
192
-
193
-
194
-
195
-
196
-
197
-
198
-
199
-
200
-
201
-
202
-
203
-
204
-
205
-
206
-
207
-
208
-
209
-
210
-
211
-
212
-
213
-
214
-
215
-
216
-
217
-
218
-
219
-
220
-
221
-
222
-
 223
223 -
 224
224 -
 225
225 -
 226
226 -
 227
227 -
 228
228 -
 229
229 -
 230
230 -
 231
231 -
 232
232 -
 233
233 -
 234
234 -
 235
235 -
 236
236 -
 237
237 -
 238
238 -
 239
239 -
 240
240 -
 241
241 -
 242
242 -
 243
243
 |
 |

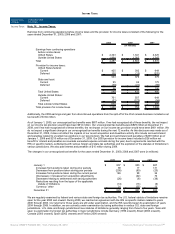
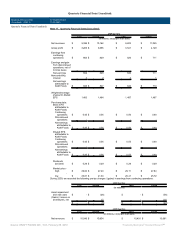
Canada & N.A. Foodservice 527 448 443
Kraft Foods Europe 785 182 455
Kraft Foods Developing Markets 936 815 588
Unrealized gains / (losses) on
hedging activities 203 (205) 16
Certain U.S. pension plan costs (165) - -
General corporate expenses (293) (304) (203)
Amortization of intangibles (26) (23) (13)
Operating income 5,524 3,843 4,176
Interest and other expense, net (1,237) (1,240) (604)
Earnings from continuing operations
before income taxes $ 4,287 $ 2,603 $ 3,572
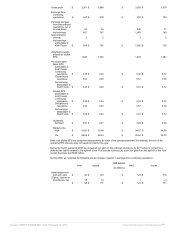
Our largest customer, Wal-Mart Stores, Inc. and its affiliates, accounted for approximately 16% of consolidated net revenues
in 2009, 16% in 2008 and 15% in 2007. These net revenues occurred primarily in the Kraft Foods North America segments.
In 2009, unrealized gains on hedging activities of $203 million primarily resulted from the 2008 unrealized losses on energy
derivatives becoming realized in 2009. In 2008, unrealized losses on hedging activities of $205 million were primarily related
to energy derivatives, including heating oil (used primarily to hedge transportation costs) and natural gas contracts. In 2009,
general corporate expenses included $50 million of charges for legal matters related to certain of our European operations
(see Part I Item 3. Legal Proceedings for a description of these matters). In 2008, we recorded $72 million in charges for legal
matters related to certain of our U.S. and European operations, including U.S. coffee operations and represented the primary
reason general corporate expenses increased $101 million in 2008.
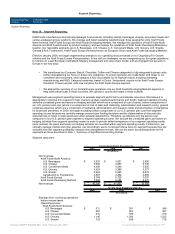
We incurred costs associated with our Cost Savings Initiatives of $318 million in 2009. These charges were recorded in
operations, primarily within the segment operating income of Kraft Foods Europe with the remainder spread across all other
segments. In 2009, we also reversed $85 million of Restructuring Program costs, with the majority relating to our Kraft Foods
Europe segment while the remainder was spread across all other segments. We incurred Restructuring Program costs of
$989 million in 2008 and $459 million in 2007. Refer to Note 6, Restructuring Costs, for a breakout of the 2008 and 2007
charges by segment. We also incurred asset impairment charges of $21 million in 2009 related to our Kraft Foods Europe
segment, $140 million in 2008 related to our Kraft Foods Europe and Kraft Foods Developing Markets segments, and $120
million in 2007 related to our U.S. Beverages segment. Refer to Note 5, Goodwill and Intangible Assets, for further details of
these charges.
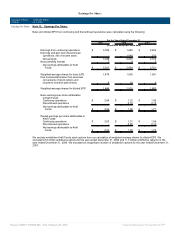
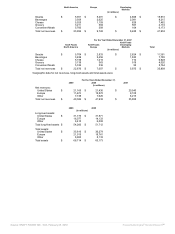
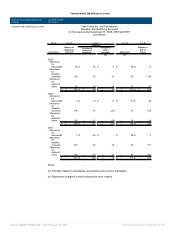
As described in Note 2, Acquisitions and Divestitures, we divested several operations, and recorded net gains / (losses) on
these divestitures in segment operating income as follows:
For the Years Ended December 31,
2009 2008 2007
(in millions)
Kraft Foods North
America:
U.S. Beverages $ - $ (1) $ (6)
U.S. Cheese - - -
U.S. Convenient
Meals - - -
U.S. Grocery - - -
U.S. Snacks 11 - 12
Canada & N.A.
Foodservice - - -
Kraft Foods Europe (17) (91) -
Kraft Foods
Developing Markets - - 8
Gains / (losses) on
divestitures, net $ (6) $ (92) $ 14
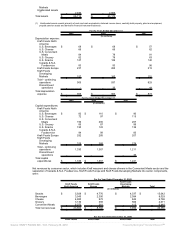
Total assets, depreciation expense and capital expenditures by segment were:
2009 2008
(in millions)
Total assets:
Kraft Foods North
America:
U.S. Beverages $ 2,382 $ 2,257
U.S. Cheese 4,589 4,599
U.S. Convenient
Meals 3,063 2,857
U.S. Grocery 5,565 5,500
U.S. Snacks 16,418 16,384
Canada & N.A.
Foodservice 5,051 4,888
Kraft Foods Europe 16,073 14,346
Kraft Foods
Developing
11,087 9,487
Source: KRAFT FOODS INC, 10-K, February 25, 2010 Powered by Morningstar® Document Research℠