Kraft 2009 Annual Report Download - page 37
Download and view the complete annual report
Please find page 37 of the 2009 Kraft annual report below. You can navigate through the pages in the report by either clicking on the pages listed below, or by using the keyword search tool below to find specific information within the annual report.-
 1
1 -
2
-
3
-
4
-
5
-
6
-
7
-
8
-
9
-
10
-
11
-
12
-
13
-
14
-
15
-
16
-
17
-
18
-
19
-
20
-
21
-
22
-
23
-
24
-
25
-
26
-
 27
27 -
 28
28 -
 29
29 -
 30
30 -
 31
31 -
 32
32 -
 33
33 -
 34
34 -
 35
35 -
 36
36 -
 37
37 -
 38
38 -
 39
39 -
 40
40 -
 41
41 -
 42
42 -
 43
43 -
 44
44 -
 45
45 -
 46
46 -
 47
47 -
48
-
49
-
50
-
51
-
52
-
53
-
54
-
55
-
56
-
57
-
58
-
59
-
60
-
61
-
62
-
63
-
64
-
65
-
66
-
67
-
68
-
69
-
70
-
71
-
72
-
73
-
74
-
75
-
76
-
77
-
78
-
79
-
80
-
81
-
82
-
83
-
84
-
85
-
86
-
87
-
88
-
89
-
90
-
91
-
92
-
93
-
94
-
95
-
96
-
97
-
98
-
99
-
100
-
101
-
102
-
103
-
104
-
105
-
106
-
107
-
108
-
109
-
110
-
111
-
112
-
113
-
114
-
115
-
116
-
117
-
118
-
119
-
120
-
121
-
122
-
123
-
124
-
125
-
126
-
127
-
128
-
129
-
130
-
131
-
132
-
133
-
134
-
135
-
136
-
137
-
138
-
139
-
140
-
141
-
142
-
143
-
144
-
145
-
146
-
147
-
148
-
149
-
150
-
151
-
152
-
153
-
154
-
155
-
156
-
157
-
158
-
159
-
160
-
161
-
162
-
163
-
164
-
165
-
166
-
167
-
168
-
169
-
170
-
171
-
172
-
173
-
174
-
175
-
176
-
177
-
178
-
179
-
180
-
181
-
182
-
183
-
184
-
185
-
186
-
187
-
188
-
189
-
190
-
191
-
192
-
193
-
194
-
195
-
196
-
197
-
198
-
199
-
200
-
201
-
202
-
203
-
204
-
205
-
206
-
207
-
208
-
209
-
210
-
211
-
212
-
213
-
214
-
215
-
216
-
217
-
218
-
219
-
220
-
221
-
222
-
223
-
224
-
225
-
226
-
227
-
228
-
229
-
230
-
231
-
232
-
233
-
234
-
235
-
236
-
237
-
238
-
239
-
240
-
241
-
242
-
243
 |
 |

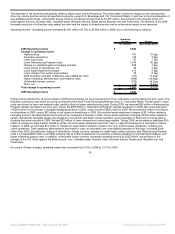
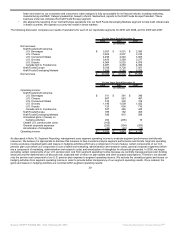
2009 compared with 2008:
Net revenues decreased $61 million (1.2%), due to unfavorable volume/mix (1.7 pp) and the impact of divestitures (0.2 pp), partially offset by
higher net pricing (0.7 pp). Biscuits net revenues increased, driven by higher input cost-driven pricing, partially offset by unfavorable volume/mix
(unfavorable product mix, net of higher shipments). Biscuits volume gain was due to higher shipments primarily in Ritz crackers, Oreo cookies,
Triscuit crackers and Chips Ahoy! cookies. Snack bars net revenues decreased, primarily due to volume declines in breakfast bars. Snack nuts
net revenues decreased, primarily driven by lower net pricing, due to higher promotional spending, and unfavorable volume/mix reflecting lower
volume due primarily to the recall of certain products containing pistachios in March 2009.
Segment operating income increased $85 million (13.3%), due primarily to lower costs due to the completion of the Restructuring Program, lower
marketing support costs, lower manufacturing costs, higher net pricing, the gain on the divestiture of our Balance bar operations in the U.S. and
lower marketing, administration and research costs. These favorable factors were partially offset by higher raw material costs and unfavorable
volume/mix (unfavorable product mix and lower shipments, including the recall of certain products containing pistachios).
2008 compared with 2007:
Net revenues increased $146 million (3.0%), due to higher net pricing (8.4 pp) and the impact of our LU Biscuit acquisition (0.4 pp), partially offset
by unfavorable volume/mix (5.6 pp) and the impact of divestitures (0.2 pp). Biscuits net revenues increased, driven by higher input cost-driven
pricing and lower promotional spending, partially offset by unfavorable volume/mix. Biscuits unfavorable volume/mix was driven by base business
volume declines in Wheat Thins crackers, Cheese Nips crackers and Chips Ahoy! cookies, partially offset by gains in Oreo cookies as well as new
product introductions including Kraft macaroni and cheese crackers and Nilla Cakesters snack cakes. Snack bars net revenues decreased, driven
by volume declines in breakfast bars, primarily due to product pruning. Snack nuts net revenues decreased, driven by lower volume, partially
offset by higher net pricing.
Segment operating income decreased $78 million (10.9%), due to unfavorable volume/mix (lower shipments and unfavorable mix), higher raw
material costs, higher manufacturing costs, higher Restructuring Program costs, higher marketing, administration and research costs, a 2007 gain
on the divestiture of our hot cereal assets and trademarks and the impact of divestitures. These unfavorable variances were partially offset by
higher net pricing and lower marketing support costs.
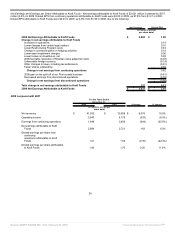
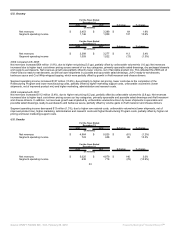
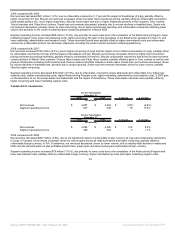
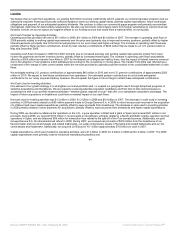
Canada & N.A. Foodservice
For the Years Ended
December 31,
2009 2008 $ change % change
(in millions)
Net revenues $ 4,087 $ 4,294 $ (207) (4.8%)
Segment operating income 527 448 79 17.6%
For the Years Ended
December 31,
2008 2007 $ change % change
(in millions)
Net revenues $ 4,294 $ 4,080 $ 214 5.2%
Segment operating income 448 443 5 1.1%
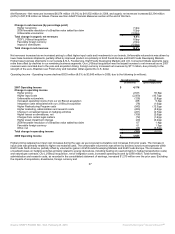
2009 compared with 2008:
Net revenues decreased $207 million (4.8%), due to the significant impact of unfavorable foreign currency (4.6 pp) and unfavorable volume/mix
(0.2 pp). In Canada, net revenues increased, driven by volume gains across all retail businesses and higher net pricing, partially offset by
unfavorable foreign currency. In N.A. Foodservice, net revenues decreased, driven by lower volume, due to industry-wide declines in restaurant
traffic and the discontinuation of less profitable product lines, lower input cost-driven pricing and unfavorable foreign currency.
Segment operating income increased $79 million (17.6%), due primarily to lower costs due to the completion of the Restructuring Program and
lower raw material costs, partially offset by unfavorable foreign currency, higher manufacturing costs and higher marketing support costs.
34
Source: KRAFT FOODS INC, 10-K, February 25, 2010 Powered by Morningstar® Document Research℠