Kraft 2009 Annual Report Download - page 105
Download and view the complete annual report
Please find page 105 of the 2009 Kraft annual report below. You can navigate through the pages in the report by either clicking on the pages listed below, or by using the keyword search tool below to find specific information within the annual report.-
 1
1 -
2
-
3
-
4
-
5
-
6
-
7
-
8
-
9
-
10
-
11
-
12
-
13
-
14
-
15
-
16
-
17
-
18
-
19
-
20
-
21
-
22
-
23
-
24
-
25
-
26
-
27
-
28
-
29
-
30
-
31
-
32
-
33
-
34
-
35
-
36
-
37
-
38
-
39
-
40
-
41
-
42
-
43
-
44
-
45
-
46
-
47
-
48
-
49
-
50
-
51
-
52
-
53
-
54
-
55
-
56
-
57
-
58
-
59
-
60
-
61
-
62
-
63
-
64
-
65
-
66
-
67
-
68
-
69
-
70
-
71
-
72
-
73
-
74
-
75
-
76
-
77
-
78
-
79
-
80
-
81
-
82
-
83
-
84
-
85
-
86
-
87
-
88
-
89
-
90
-
91
-
92
-
93
-
94
-
 95
95 -
 96
96 -
 97
97 -
 98
98 -
 99
99 -
 100
100 -
 101
101 -
 102
102 -
 103
103 -
 104
104 -
 105
105 -
 106
106 -
 107
107 -
 108
108 -
 109
109 -
 110
110 -
 111
111 -
 112
112 -
 113
113 -
 114
114 -
 115
115 -
116
-
117
-
118
-
119
-
120
-
121
-
122
-
123
-
124
-
125
-
126
-
127
-
128
-
129
-
130
-
131
-
132
-
133
-
134
-
135
-
136
-
137
-
138
-
139
-
140
-
141
-
142
-
143
-
144
-
145
-
146
-
147
-
148
-
149
-
150
-
151
-
152
-
153
-
154
-
155
-
156
-
157
-
158
-
159
-
160
-
161
-
162
-
163
-
164
-
165
-
166
-
167
-
168
-
169
-
170
-
171
-
172
-
173
-
174
-
175
-
176
-
177
-
178
-
179
-
180
-
181
-
182
-
183
-
184
-
185
-
186
-
187
-
188
-
189
-
190
-
191
-
192
-
193
-
194
-
195
-
196
-
197
-
198
-
199
-
200
-
201
-
202
-
203
-
204
-
205
-
206
-
207
-
208
-
209
-
210
-
211
-
212
-
213
-
214
-
215
-
216
-
217
-
218
-
219
-
220
-
221
-
222
-
223
-
224
-
225
-
226
-
227
-
228
-
229
-
230
-
231
-
232
-
233
-
234
-
235
-
236
-
237
-
238
-
239
-
240
-
241
-
242
-
243
 |
 |

For the Years Ended December 31,
2009 2008 2007
(in millions)
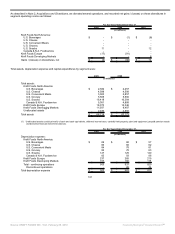
Capital expenditures:
Kraft Foods North America:
U.S. Beverages $ 82 $ 110 $ 90
U.S. Cheese 72 97 115
U.S. Convenient Meals 196 200 207
U.S. Grocery 85 87 99
U.S. Snacks 190 122 136
Canada & N.A. Foodservice 94 98 83
Kraft Foods Europe 292 285 207
Kraft Foods Developing Markets 319 368 274
Total - continuing operations 1,330 1,367 1,211
Discontinued operations - - 30
Total capital expenditures $ 1,330 $ 1,367 $ 1,241
Net revenues by consumer sector, which includes Kraft macaroni and cheese dinners in the Convenient Meals sector and the separation of
Canada & N.A. Foodservice, Kraft Foods Europe and Kraft Foods Developing Markets into sector components, were:
For the Year Ended December 31, 2009
Kraft Foods
North America
Kraft Foods
Europe
Kraft Foods
Developing
Markets Total
(in millions)
Snacks $ 5,929 $ 4,776 $ 4,337 $ 15,042
Beverages 3,545 2,390 2,094 8,029
Cheese 4,980 972 844 6,796
Grocery 3,136 369 566 4,071
Convenient Meals 6,072 261 115 6,448
Total net revenues $ 23,662 $ 8,768 $ 7,956 $ 40,386
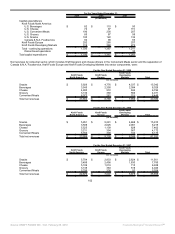
For the Year Ended December 31, 2008
Kraft Foods
North America
Kraft Foods
Europe
Kraft Foods
Developing
Markets Total
(in millions)
Snacks $ 5,951 $ 5,291 $ 4,668 $ 15,910
Beverages 3,509 2,625 2,081 8,215
Cheese 5,525 1,109 828 7,462
Grocery 3,211 394 567 4,172
Convenient Meals 5,760 309 104 6,173
Total net revenues $ 23,956 $ 9,728 $ 8,248 $ 41,932
For the Year Ended December 31, 2007
Kraft Foods
North America
Kraft Foods
Europe
Kraft Foods
Developing
Markets Total
(in millions)
Snacks $ 5,704 $ 2,833 $ 2,824 $ 11,361
Beverages 3,499 2,456 1,830 7,785
Cheese 5,199 1,019 710 6,928
Grocery 3,138 363 519 4,020
Convenient Meals 5,336 336 92 5,764
Total net revenues $ 22,876 $ 7,007 $ 5,975 $ 35,858
102
Source: KRAFT FOODS INC, 10-K, February 25, 2010 Powered by Morningstar® Document Research℠