Kraft 2009 Annual Report Download - page 221
Download and view the complete annual report
Please find page 221 of the 2009 Kraft annual report below. You can navigate through the pages in the report by either clicking on the pages listed below, or by using the keyword search tool below to find specific information within the annual report.-
 1
1 -
2
-
3
-
4
-
5
-
6
-
7
-
8
-
9
-
10
-
11
-
12
-
13
-
14
-
15
-
16
-
17
-
18
-
19
-
20
-
21
-
22
-
23
-
24
-
25
-
26
-
27
-
28
-
29
-
30
-
31
-
32
-
33
-
34
-
35
-
36
-
37
-
38
-
39
-
40
-
41
-
42
-
43
-
44
-
45
-
46
-
47
-
48
-
49
-
50
-
51
-
52
-
53
-
54
-
55
-
56
-
57
-
58
-
59
-
60
-
61
-
62
-
63
-
64
-
65
-
66
-
67
-
68
-
69
-
70
-
71
-
72
-
73
-
74
-
75
-
76
-
77
-
78
-
79
-
80
-
81
-
82
-
83
-
84
-
85
-
86
-
87
-
88
-
89
-
90
-
91
-
92
-
93
-
94
-
95
-
96
-
97
-
98
-
99
-
100
-
101
-
102
-
103
-
104
-
105
-
106
-
107
-
108
-
109
-
110
-
111
-
112
-
113
-
114
-
115
-
116
-
117
-
118
-
119
-
120
-
121
-
122
-
123
-
124
-
125
-
126
-
127
-
128
-
129
-
130
-
131
-
132
-
133
-
134
-
135
-
136
-
137
-
138
-
139
-
140
-
141
-
142
-
143
-
144
-
145
-
146
-
147
-
148
-
149
-
150
-
151
-
152
-
153
-
154
-
155
-
156
-
157
-
158
-
159
-
160
-
161
-
162
-
163
-
164
-
165
-
166
-
167
-
168
-
169
-
170
-
171
-
172
-
173
-
174
-
175
-
176
-
177
-
178
-
179
-
180
-
181
-
182
-
183
-
184
-
185
-
186
-
187
-
188
-
189
-
190
-
191
-
192
-
193
-
194
-
195
-
196
-
197
-
198
-
199
-
200
-
201
-
202
-
203
-
204
-
205
-
206
-
207
-
208
-
209
-
210
-
 211
211 -
 212
212 -
 213
213 -
 214
214 -
 215
215 -
 216
216 -
 217
217 -
 218
218 -
 219
219 -
 220
220 -
 221
221 -
 222
222 -
 223
223 -
 224
224 -
 225
225 -
 226
226 -
 227
227 -
 228
228 -
 229
229 -
 230
230 -
 231
231 -
232
-
233
-
234
-
235
-
236
-
237
-
238
-
239
-
240
-
241
-
242
-
243
 |
 |

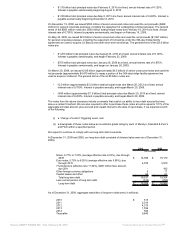
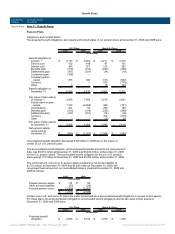
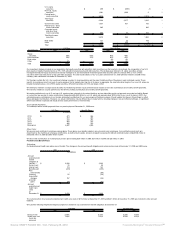
Accumulated benefit
obligation 4,166 5,464 3,478 1,664
Fair value of plan assets 3,932 4,386 2,629 1,144
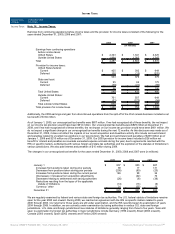
We used the following weighted-average assumptions to determine our benefit obligations under the pension plans at
December 31:
U.S. Plans Non-U.S. Plans
2009 2008 2009 2008
Discount rate 5.93% 6.10% 5.21% 6.41%
Expected rate of return
on
plan assets 8.00% 8.00% 7.26% 7.25%
Rate of compensation
increase 4.00% 4.00% 3.08% 3.09%
Year-end discount rates for our U.S. and Canadian plans were developed from a model portfolio of high quality, fixed-income
debt instruments with durations that match the expected future cash flows of the benefit obligations. Year-end discount rates
for our non-U.S. plans (other than Canadian plans) were developed from local bond indices that match local benefit
obligations as closely as possible. Changes in our discount rates were primarily the result of changes in bond yields
year-over-year. We determine our expected rate of return on plan assets from the plan assets’ historical long-term investment
performance, current asset allocation and estimates of future long-term returns by asset class.
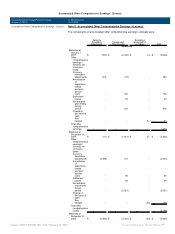
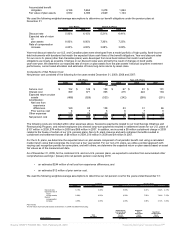
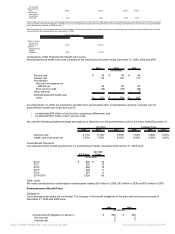
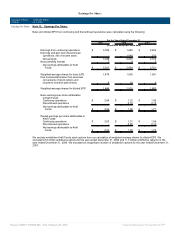
Components of Net Pension Cost:
Net pension cost consisted of the following for the years ended December 31, 2009, 2008 and 2007:
U.S. Plans Non-U.S. Plans
2009 2008 2007 2009 2008 2007
(in millions)
Service cost $ 152 $ 149 $ 159 $ 67 $ 91 $ 101
Interest cost 369 371 365 215 222 194
Expected return on plan
assets (486) (526) (523) (242) (285) (251)
Amortization:
Net loss from
experience
differences 160 85 138 23 31 66
Prior service cost 6 7 5 6 7 9
Other expenses 112 74 68 8 16 4
Net pension cost $ 313 $ 160 $ 212 $ 77 $ 82 $ 123
The following costs are included within other expenses above. Severance payments related to our Cost Savings Initiatives and
Restructuring Program, and retired employees who elected lump-sum payments resulted in settlement losses for our U.S. plans of
$107 million in 2009, $74 million in 2008 and $68 million in 2007. In addition, we incurred a $5 million curtailment charge in 2009
related to the freeze of certain of our U.S. pension plans. Non-U.S. plant closures and early retirement benefits resulted in
curtailment and settlement losses of $8 million in 2009, $16 million in 2008 and $4 million in 2007.
For the U.S. plans, we determine the expected return on plan assets component of net periodic benefit cost using a calculated
market return value that recognizes the cost over a four year period. For our non-U.S. plans, we utilize a similar approach with
varying cost recognition periods for some plans, and with others, we determine the expected return on plan assets based on asset
fair values as of the measurement date.
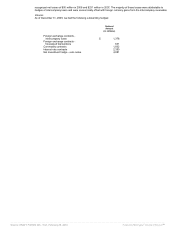
As of December 31, 2009, for the combined U.S. and non-U.S. pension plans, we expected to amortize from accumulated other
comprehensive earnings / (losses) into net periodic pension cost during 2010:
• an estimated $244 million of net loss from experience differences; and
• an estimated $12 million of prior service cost.
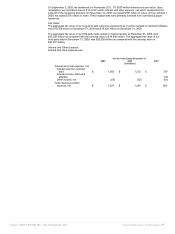
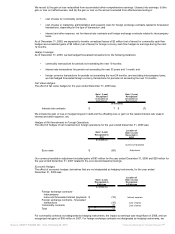
We used the following weighted-average assumptions to determine our net pension cost for the years ended December 31:
U.S. Plans Non-U.S. Plans
2009 2008 2007 2009 2008 2007
Discount rate 6.10% 6.30% 5.90% 6.41% 5.44% 4.67%
Expected rate of
return
on plan assets 8.00% 8.00% 8.00% 7.25% 7.43% 7.53%
Rate of
compensation
increase 4.00% 4.00% 4.00% 3.09% 3.13% 3.00%
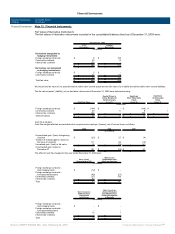
Plan Assets:
The fair value of pension plan assets at December 31, 2009 was determined using:
Asset Category
Total
Fair Value
Quoted Prices
in Active Market
for Identical
Assets
(Level 1)
Significant
Other
Observable
Inputs
(Level 2)
Significant
Unobservable
Inputs
(Level 3)
(in millions)
Source: KRAFT FOODS INC, 10-K, February 25, 2010 Powered by Morningstar® Document Research℠