Kraft 2009 Annual Report Download - page 222
Download and view the complete annual report
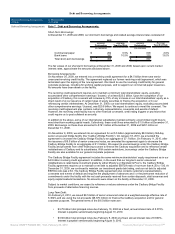
Please find page 222 of the 2009 Kraft annual report below. You can navigate through the pages in the report by either clicking on the pages listed below, or by using the keyword search tool below to find specific information within the annual report.-
 1
1 -
2
-
3
-
4
-
5
-
6
-
7
-
8
-
9
-
10
-
11
-
12
-
13
-
14
-
15
-
16
-
17
-
18
-
19
-
20
-
21
-
22
-
23
-
24
-
25
-
26
-
27
-
28
-
29
-
30
-
31
-
32
-
33
-
34
-
35
-
36
-
37
-
38
-
39
-
40
-
41
-
42
-
43
-
44
-
45
-
46
-
47
-
48
-
49
-
50
-
51
-
52
-
53
-
54
-
55
-
56
-
57
-
58
-
59
-
60
-
61
-
62
-
63
-
64
-
65
-
66
-
67
-
68
-
69
-
70
-
71
-
72
-
73
-
74
-
75
-
76
-
77
-
78
-
79
-
80
-
81
-
82
-
83
-
84
-
85
-
86
-
87
-
88
-
89
-
90
-
91
-
92
-
93
-
94
-
95
-
96
-
97
-
98
-
99
-
100
-
101
-
102
-
103
-
104
-
105
-
106
-
107
-
108
-
109
-
110
-
111
-
112
-
113
-
114
-
115
-
116
-
117
-
118
-
119
-
120
-
121
-
122
-
123
-
124
-
125
-
126
-
127
-
128
-
129
-
130
-
131
-
132
-
133
-
134
-
135
-
136
-
137
-
138
-
139
-
140
-
141
-
142
-
143
-
144
-
145
-
146
-
147
-
148
-
149
-
150
-
151
-
152
-
153
-
154
-
155
-
156
-
157
-
158
-
159
-
160
-
161
-
162
-
163
-
164
-
165
-
166
-
167
-
168
-
169
-
170
-
171
-
172
-
173
-
174
-
175
-
176
-
177
-
178
-
179
-
180
-
181
-
182
-
183
-
184
-
185
-
186
-
187
-
188
-
189
-
190
-
191
-
192
-
193
-
194
-
195
-
196
-
197
-
198
-
199
-
200
-
201
-
202
-
203
-
204
-
205
-
206
-
207
-
208
-
209
-
210
-
211
-
 212
212 -
 213
213 -
 214
214 -
 215
215 -
 216
216 -
 217
217 -
 218
218 -
 219
219 -
 220
220 -
 221
221 -
 222
222 -
 223
223 -
 224
224 -
 225
225 -
 226
226 -
 227
227 -
 228
228 -
 229
229 -
 230
230 -
 231
231 -
 232
232 -
233
-
234
-
235
-
236
-
237
-
238
-
239
-
240
-
241
-
242
-
243
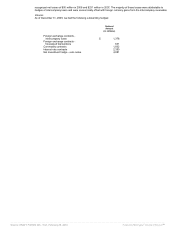
 |
 |

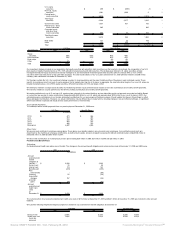
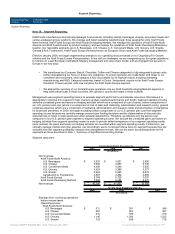
U.S. equity
securities $ 289 $ 289 $ - $ -
Non-U.S. equity
securities 1,991 1,988 2 1
Pooled funds -
equity securities 3,014 - 3,014 -
Total equity
securities 5,294 2,277 3,016 1
Government bonds 1,037 931 106 -
Pooled funds - fixed
income securities 945 - 945 -
Corporate bonds
and other fixed
income securities 988 54 932 2
Total fixed income
securities 2,970 985 1,983 2
Real estate 131 22 109 -
Other 326 322 2 2
Total $ 8,721 $ 3,606 $ 5,110 $ 5
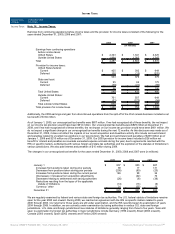
U.S. Plans Non-U.S. Plans
Asset Category 2009 2008 2009 2008
Equity
securities 68% 65% 50% 45%
Debt securities 28% 35% 43% 45%
Real estate - - 4% 4%
Other 4% - 3% 6%
Total 100% 100% 100% 100%
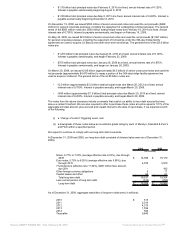
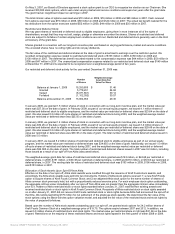
Our investment strategy is based on our expectation that equity securities will outperform debt securities over the long term. Accordingly, the composition of our U.S.
plan assets is broadly characterized as a 70% / 30% allocation between equity and debt securities. The strategy uses indexed U.S. equity securities, actively
managed international equity securities and actively managed U.S. and international investment grade debt securities (which constitute 90% or more of debt
securities) with lesser allocations to high yield debt securities. The other asset balance of our U.S. plans at December 31, 2009 primarily related to a $200 million
voluntary cash contribution we made on December 31, 2009.
For the plans outside the U.S., the investment strategy is subject to local regulations and the asset / liability profiles of the plans in each individual country. These
specific circumstances result in a level of equity exposure that is typically less than the U.S. plans. In aggregate, the asset allocation targets of our non-U.S. plans are
broadly characterized as a mix of 50% equity securities, 40% debt securities and 10% real estate / other.
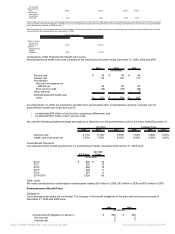
We attempt to maintain our target asset allocation by rebalancing between equity and debt asset classes as we make contributions and monthly benefit payments.
We intend to rebalance our plan portfolios by mid-2010 by making contributions and monthly benefit payments.
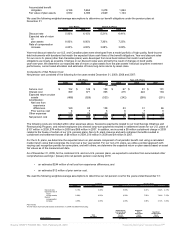
We make contributions to our U.S. and non-U.S. pension plans, primarily, to the extent that they are tax deductible and do not generate an excise tax liability. Based
on current tax law, we plan to make contributions of approximately $40 million to our U.S. plans and approximately $200 million to our non-U.S. plans in 2010. Our
estimated pension contributions do not include anticipated contributions for our newly acquired Cadbury business. We will update this figure in future filings to reflect
these anticipated contributions. However, our actual contributions may be different due to many factors, including changes in tax and other benefit laws, or significant
differences between expected and actual pension asset performance or interest rates.
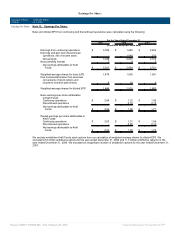
Future Benefit Payments:
The estimated future benefit payments from our pension plans at December 31, 2009 were:
U.S. Plans Non-U.S. Plans
(in millions)
2010 $ 473 $ 246
2011 453 246
2012 443 253
2013 450 256
2014 440 260
2015-2019 2,557 1,419
Other Costs:
We sponsor and contribute to employee savings plans. These plans cover eligible salaried, non-union and union employees. Our contributions and costs are
determined by the matching of employee contributions, as defined by the plans. Amounts charged to expense for defined contribution plans totaled $94 million in
2009, $93 million in 2008 and $83 million in 2007.
We also made contributions to multiemployer pension plans totaling $29 million in 2009, $27 million in 2008 and $26 million in 2007.
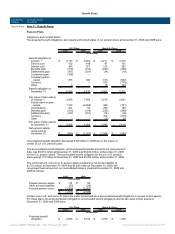
Postretirement Benefit Plans
Obligations:
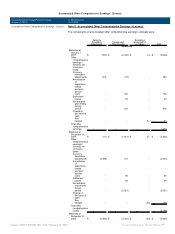
Our postretirement health care plans are not funded. The changes in the accrued benefit obligation and net amount accrued at December 31, 2009 and 2008 were:
2009 2008
(in millions)
Accrued
postretirement
benefit
obligation at
January 1 $ 2,899 $ 3,063
Service cost 35 44
Interest cost 174 183
Benefits paid (210) (206)
Plan
amendments
- (84)
Currency 25 (30)
Assumption
changes 157 (28)
Actuarial
gains (48) (43)
Accrued
postretirement
health care
costs
at
December 31 $ 3,032 $ 2,899
The current portion of our accrued postretirement health care costs of $216 million at December 31, 2009 and $221 million at December 31, 2008 was included in other accrued
liabilities.
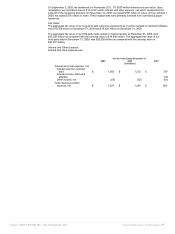
We used the following weighted-average assumptions to determine our postretirement benefit obligations at December 31:
U.S. Plans Canadian Plans
2009 2008 2009 2008
Discount rate 5.70% 6.10% 5.25% 7.60%
Health care cost
trend rate
assumed
7.00% 7.00% 9.00% 9.00%
Source: KRAFT FOODS INC, 10-K, February 25, 2010 Powered by Morningstar® Document Research℠