Kraft 2009 Annual Report Download - page 32
Download and view the complete annual report
Please find page 32 of the 2009 Kraft annual report below. You can navigate through the pages in the report by either clicking on the pages listed below, or by using the keyword search tool below to find specific information within the annual report.-
 1
1 -
2
-
3
-
4
-
5
-
6
-
7
-
8
-
9
-
10
-
11
-
12
-
13
-
14
-
15
-
16
-
17
-
18
-
19
-
20
-
21
-
 22
22 -
 23
23 -
 24
24 -
 25
25 -
 26
26 -
 27
27 -
 28
28 -
 29
29 -
 30
30 -
 31
31 -
 32
32 -
 33
33 -
 34
34 -
 35
35 -
 36
36 -
 37
37 -
 38
38 -
 39
39 -
 40
40 -
 41
41 -
 42
42 -
43
-
44
-
45
-
46
-
47
-
48
-
49
-
50
-
51
-
52
-
53
-
54
-
55
-
56
-
57
-
58
-
59
-
60
-
61
-
62
-
63
-
64
-
65
-
66
-
67
-
68
-
69
-
70
-
71
-
72
-
73
-
74
-
75
-
76
-
77
-
78
-
79
-
80
-
81
-
82
-
83
-
84
-
85
-
86
-
87
-
88
-
89
-
90
-
91
-
92
-
93
-
94
-
95
-
96
-
97
-
98
-
99
-
100
-
101
-
102
-
103
-
104
-
105
-
106
-
107
-
108
-
109
-
110
-
111
-
112
-
113
-
114
-
115
-
116
-
117
-
118
-
119
-
120
-
121
-
122
-
123
-
124
-
125
-
126
-
127
-
128
-
129
-
130
-
131
-
132
-
133
-
134
-
135
-
136
-
137
-
138
-
139
-
140
-
141
-
142
-
143
-
144
-
145
-
146
-
147
-
148
-
149
-
150
-
151
-
152
-
153
-
154
-
155
-
156
-
157
-
158
-
159
-
160
-
161
-
162
-
163
-
164
-
165
-
166
-
167
-
168
-
169
-
170
-
171
-
172
-
173
-
174
-
175
-
176
-
177
-
178
-
179
-
180
-
181
-
182
-
183
-
184
-
185
-
186
-
187
-
188
-
189
-
190
-
191
-
192
-
193
-
194
-
195
-
196
-
197
-
198
-
199
-
200
-
201
-
202
-
203
-
204
-
205
-
206
-
207
-
208
-
209
-
210
-
211
-
212
-
213
-
214
-
215
-
216
-
217
-
218
-
219
-
220
-
221
-
222
-
223
-
224
-
225
-
226
-
227
-
228
-
229
-
230
-
231
-
232
-
233
-
234
-
235
-
236
-
237
-
238
-
239
-
240
-
241
-
242
-
243
 |
 |

faster and closer to our customers and consumers, each category is fully accountable for its financial results, including marketing,
manufacturing and R&D. Category leadership, based in Zurich, Switzerland, reports to the Kraft Foods Europe President. These
business units now comprise the Kraft Foods Europe segment.
• We aligned the reporting of our Central Europe operations into our Kraft Foods Developing Markets segment to help build critical scale
in these countries. We operate a country-led model in these markets.
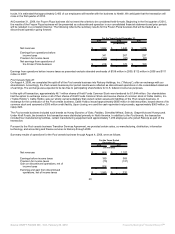
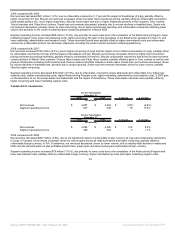
The following discussion compares our results of operations for each of our reportable segments for 2009 with 2008, and for 2008 with 2007.
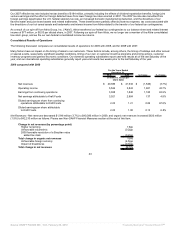
For the Years Ended December 31,
2009 2008 2007
(in millions)
Net revenues:
Kraft Foods North America:
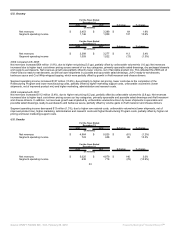
U.S. Beverages $ 3,057 $ 3,001 $ 2,990
U.S. Cheese 3,605 4,007 3,745
U.S. Convenient Meals 4,496 4,240 3,905
U.S. Grocery 3,453 3,389 3,277
U.S. Snacks 4,964 5,025 4,879
Canada & N.A. Foodservice 4,087 4,294 4,080
Kraft Foods Europe 8,768 9,728 7,007
Kraft Foods Developing Markets 7,956 8,248 5,975
Net revenues $ 40,386 $ 41,932 $ 35,858
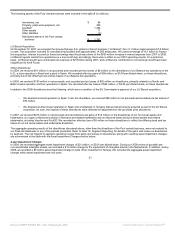
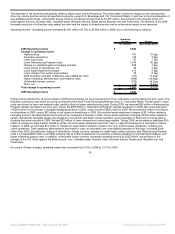
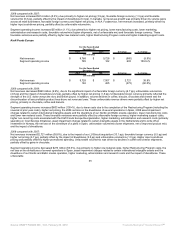
For the Years Ended December 31,
2009 2008 2007
(in millions)
Operating income:
Kraft Foods North America:
U.S. Beverages $ 511 $ 381 $ 346
U.S. Cheese 667 563 487
U.S. Convenient Meals 510 339 319
U.S. Grocery 1,146 1,009 1,022
U.S. Snacks 723 638 716
Canada & N.A. Foodservice 527 448 443
Kraft Foods Europe 785 182 455
Kraft Foods Developing Markets 936 815 588
Unrealized gains / (losses) on
hedging activities 203 (205) 16
Certain U.S. pension plan costs (165) - -
General corporate expenses (293) (304) (203)
Amortization of intangibles (26) (23) (13)
Operating income $ 5,524 $ 3,843 $ 4,176
As discussed in Note 16, Segment Reporting, management uses segment operating income to evaluate segment performance and allocate
resources. We believe it is appropriate to disclose this measure to help investors analyze segment performance and trends. Segment operating
income excludes unrealized gains and losses on hedging activities (which are a component of cost of sales), certain components of our U.S.
pension plan cost (which is a component of cost of sales and marketing, administration and research costs), general corporate expenses (which
are a component of marketing, administration and research costs) and amortization of intangibles for all periods presented. In 2009, we began
excluding certain components of our U.S. pension plan cost from segment operating income because we centrally manage pension plan funding
decisions and the determination of discount rate, expected rate of return on plan assets and other actuarial assumptions. Therefore, we allocate
only the service cost component of our U.S. pension plan expense to segment operating income. We exclude the unrealized gains and losses on
hedging activities from segment operating income in order to provide better transparency of our segment operating results. Once realized, the
gains and losses on hedging activities are recorded within segment operating results.
29
Source: KRAFT FOODS INC, 10-K, February 25, 2010 Powered by Morningstar® Document Research℠