Kraft 2009 Annual Report Download - page 102
Download and view the complete annual report
Please find page 102 of the 2009 Kraft annual report below. You can navigate through the pages in the report by either clicking on the pages listed below, or by using the keyword search tool below to find specific information within the annual report.-
 1
1 -
2
-
3
-
4
-
5
-
6
-
7
-
8
-
9
-
10
-
11
-
12
-
13
-
14
-
15
-
16
-
17
-
18
-
19
-
20
-
21
-
22
-
23
-
24
-
25
-
26
-
27
-
28
-
29
-
30
-
31
-
32
-
33
-
34
-
35
-
36
-
37
-
38
-
39
-
40
-
41
-
42
-
43
-
44
-
45
-
46
-
47
-
48
-
49
-
50
-
51
-
52
-
53
-
54
-
55
-
56
-
57
-
58
-
59
-
60
-
61
-
62
-
63
-
64
-
65
-
66
-
67
-
68
-
69
-
70
-
71
-
72
-
73
-
74
-
75
-
76
-
77
-
78
-
79
-
80
-
81
-
82
-
83
-
84
-
85
-
86
-
87
-
88
-
89
-
90
-
91
-
 92
92 -
 93
93 -
 94
94 -
 95
95 -
 96
96 -
 97
97 -
 98
98 -
 99
99 -
 100
100 -
 101
101 -
 102
102 -
 103
103 -
 104
104 -
 105
105 -
 106
106 -
 107
107 -
 108
108 -
 109
109 -
 110
110 -
 111
111 -
 112
112 -
113
-
114
-
115
-
116
-
117
-
118
-
119
-
120
-
121
-
122
-
123
-
124
-
125
-
126
-
127
-
128
-
129
-
130
-
131
-
132
-
133
-
134
-
135
-
136
-
137
-
138
-
139
-
140
-
141
-
142
-
143
-
144
-
145
-
146
-
147
-
148
-
149
-
150
-
151
-
152
-
153
-
154
-
155
-
156
-
157
-
158
-
159
-
160
-
161
-
162
-
163
-
164
-
165
-
166
-
167
-
168
-
169
-
170
-
171
-
172
-
173
-
174
-
175
-
176
-
177
-
178
-
179
-
180
-
181
-
182
-
183
-
184
-
185
-
186
-
187
-
188
-
189
-
190
-
191
-
192
-
193
-
194
-
195
-
196
-
197
-
198
-
199
-
200
-
201
-
202
-
203
-
204
-
205
-
206
-
207
-
208
-
209
-
210
-
211
-
212
-
213
-
214
-
215
-
216
-
217
-
218
-
219
-
220
-
221
-
222
-
223
-
224
-
225
-
226
-
227
-
228
-
229
-
230
-
231
-
232
-
233
-
234
-
235
-
236
-
237
-
238
-
239
-
240
-
241
-
242
-
243
 |
 |

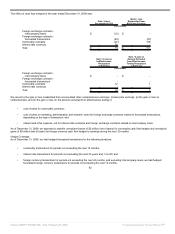
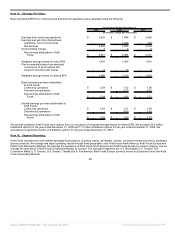
Effective January 2009, we began implementing changes to our operating structure based on our Organizing For Growth initiative and the Kraft
Foods Europe Reorganization. In line with our strategies, we are reorganizing our European operations to function on a pan-European centralized
category management and value chain model, and we changed how we work in Europe in two key ways:
• We transitioned our European Biscuit, Chocolate, Coffee and Cheese categories to fully integrated business units, further
strengthening our focus on these core categories. To ensure decisions are made faster and closer to our customers and consumers,
each category is fully accountable for its financial results, including marketing, manufacturing and R&D. Category leadership, based in
Zurich, Switzerland, reports to the Kraft Foods Europe President. These business units now comprise the Kraft Foods Europe
segment.
• We aligned the reporting of our Central Europe operations into our Kraft Foods Developing Markets segment to help build critical scale
in these countries. We operate a country-led model in these markets.
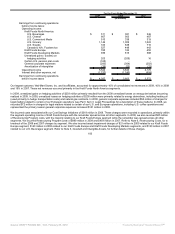
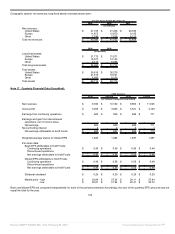
Management uses segment operating income to evaluate segment performance and allocate resources. We believe it is appropriate to disclose
this measure to help investors analyze segment performance and trends. Segment operating income excludes unrealized gains and losses on
hedging activities (which are a component of cost of sales), certain components of our U.S. pension plan cost (which is a component of cost of
sales and marketing, administration and research costs), general corporate expenses (which are a component of marketing, administration and
research costs) and amortization of intangibles for all periods presented. In 2009, we began excluding certain components of our U.S. pension
plan cost from segment operating income because we centrally manage pension plan funding decisions and the determination of discount rate,
expected rate of return on plan assets and other actuarial assumptions. Therefore, we allocate only the service cost component of our U.S.
pension plan expense to segment operating income. We exclude the unrealized gains and losses on hedging activities from segment operating
income in order to provide better transparency of our segment operating results. Once realized, the gains and losses on hedging activities are
recorded within segment operating results. Furthermore, we centrally manage interest and other expense, net. Accordingly, we do not present
these items by segment because they are excluded from the segment profitability measure that management reviews. We use the same
accounting policies for the segments as those described in Note 1, Summary of Significant Accounting Policies.
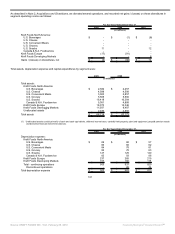
Segment data were:
For the Years Ended December 31,
2009 2008 2007
(in millions)
Net revenues:
Kraft Foods North America:
U.S. Beverages $ 3,057 $ 3,001 $ 2,990
U.S. Cheese 3,605 4,007 3,745
U.S. Convenient Meals 4,496 4,240 3,905
U.S. Grocery 3,453 3,389 3,277
U.S. Snacks 4,964 5,025 4,879
Canada & N.A. Foodservice 4,087 4,294 4,080
Kraft Foods Europe 8,768 9,728 7,007
Kraft Foods Developing Markets 7,956 8,248 5,975
Net revenues $ 40,386 $ 41,932 $ 35,858
99
Source: KRAFT FOODS INC, 10-K, February 25, 2010 Powered by Morningstar® Document Research℠