Kraft 2009 Annual Report Download - page 38
Download and view the complete annual report
Please find page 38 of the 2009 Kraft annual report below. You can navigate through the pages in the report by either clicking on the pages listed below, or by using the keyword search tool below to find specific information within the annual report.-
 1
1 -
2
-
3
-
4
-
5
-
6
-
7
-
8
-
9
-
10
-
11
-
12
-
13
-
14
-
15
-
16
-
17
-
18
-
19
-
20
-
21
-
22
-
23
-
24
-
25
-
26
-
27
-
 28
28 -
 29
29 -
 30
30 -
 31
31 -
 32
32 -
 33
33 -
 34
34 -
 35
35 -
 36
36 -
 37
37 -
 38
38 -
 39
39 -
 40
40 -
 41
41 -
 42
42 -
 43
43 -
 44
44 -
 45
45 -
 46
46 -
 47
47 -
 48
48 -
49
-
50
-
51
-
52
-
53
-
54
-
55
-
56
-
57
-
58
-
59
-
60
-
61
-
62
-
63
-
64
-
65
-
66
-
67
-
68
-
69
-
70
-
71
-
72
-
73
-
74
-
75
-
76
-
77
-
78
-
79
-
80
-
81
-
82
-
83
-
84
-
85
-
86
-
87
-
88
-
89
-
90
-
91
-
92
-
93
-
94
-
95
-
96
-
97
-
98
-
99
-
100
-
101
-
102
-
103
-
104
-
105
-
106
-
107
-
108
-
109
-
110
-
111
-
112
-
113
-
114
-
115
-
116
-
117
-
118
-
119
-
120
-
121
-
122
-
123
-
124
-
125
-
126
-
127
-
128
-
129
-
130
-
131
-
132
-
133
-
134
-
135
-
136
-
137
-
138
-
139
-
140
-
141
-
142
-
143
-
144
-
145
-
146
-
147
-
148
-
149
-
150
-
151
-
152
-
153
-
154
-
155
-
156
-
157
-
158
-
159
-
160
-
161
-
162
-
163
-
164
-
165
-
166
-
167
-
168
-
169
-
170
-
171
-
172
-
173
-
174
-
175
-
176
-
177
-
178
-
179
-
180
-
181
-
182
-
183
-
184
-
185
-
186
-
187
-
188
-
189
-
190
-
191
-
192
-
193
-
194
-
195
-
196
-
197
-
198
-
199
-
200
-
201
-
202
-
203
-
204
-
205
-
206
-
207
-
208
-
209
-
210
-
211
-
212
-
213
-
214
-
215
-
216
-
217
-
218
-
219
-
220
-
221
-
222
-
223
-
224
-
225
-
226
-
227
-
228
-
229
-
230
-
231
-
232
-
233
-
234
-
235
-
236
-
237
-
238
-
239
-
240
-
241
-
242
-
243
 |
 |

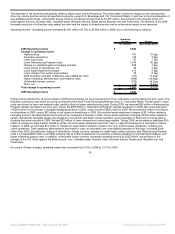
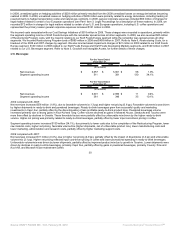
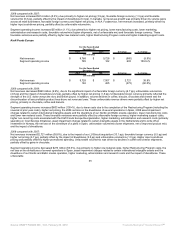
2008 compared with 2007:
Net revenues increased $214 million (5.2%), due primarily to higher net pricing (3.9 pp), favorable foreign currency (1.3 pp) and favorable
volume/mix (0.3 pp), partially offset by the impact of divestitures (0.4 pp). In Canada, net revenues growth was primarily driven by volume gains
across all retail businesses, favorable foreign currency and higher net pricing. In N.A. Foodservice, net revenues increased, primarily driven by
higher input cost-driven pricing, partially offset by unfavorable volume/mix.
Segment operating income increased $5 million (1.1%), due primarily to higher net pricing, lower manufacturing costs, lower marketing,
administration and research costs, favorable volume/mix (higher shipments, net of unfavorable mix) and favorable foreign currency. These
favorable variances were partially offset by higher raw material costs, higher Restructuring Program costs and higher marketing support costs.
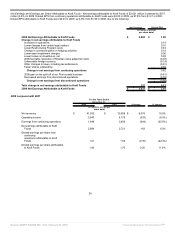
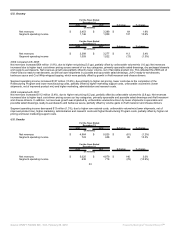
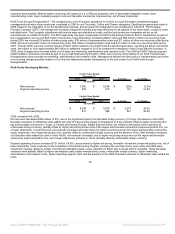
Kraft Foods Europe
For the Years Ended
December 31,
2009 2008 $ change % change
(in millions)
Net revenues $ 8,768 $ 9,728 $ (960) (9.9%)
Segment operating income 785 182 603 100.0+%
For the Years Ended
December 31,
2008 2007 $ change % change
(in millions)
Net revenues $ 9,728 $ 7,007 $ 2,721 38.8%
Segment operating income 182 455 (273) (60.0%)
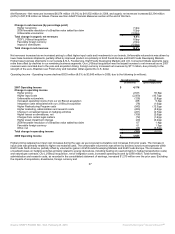
2009 compared with 2008:
Net revenues decreased $960 million (9.9%), due to the significant impact of unfavorable foreign currency (6.7 pp), unfavorable volume/mix
(2.8 pp) and the impact of divestitures (2.2 pp), partially offset by higher net pricing (1.8 pp). Unfavorable foreign currency primarily reflected the
strength of the U.S. dollar versus the euro and British pound. In addition, volume declines in coffee, biscuits, chocolate and cheese and the
discontinuation of less profitable product lines drove net revenues lower. These unfavorable revenue drivers were partially offset by higher net
pricing, primarily in chocolate, coffee and biscuits.
Segment operating income increased $603 million (100+%), due to lower costs due to the completion of the Restructuring Program (including the
reversal of prior year costs), higher net pricing, the 2008 net loss on the divestitures of several operations in Spain, 2008 asset impairment
charges related to certain international intangible assets and the divestiture of our Nordic and Baltic snacks operation, lower manufacturing costs
and lower raw material costs. These favorable variances were partially offset by unfavorable foreign currency, higher marketing support costs,
higher non-recurring costs associated with the Kraft Foods Europe Reorganization, higher marketing, administration and research costs (primarily
spending on Cost Savings Initiatives), asset impairment charges related to certain intangible assets in the Netherlands and to write off an
investment in Norway, the net loss on the divestiture of a plant in Spain, unfavorable volume/mix (lower shipments, net of improved product mix)
and the impact of divestitures.
2008 compared with 2007:
Net revenues increased $2,721 million (38.8%), due to the impact of our LU Biscuit acquisition (33.1 pp), favorable foreign currency (5.5 pp) and
higher net pricing (4.7 pp), partially offset by the impact of divestitures (3.5 pp) and unfavorable volume/mix (1.0 pp). Higher input cost-driven
pricing was partially offset by higher promotional spending. Unfavorable volume/mix was driven by declines in coffee and cheese shipments,
partially offset by gains in chocolate.
Segment operating income decreased $273 million (60.0%), due primarily to higher raw material costs, higher Restructuring Program costs, the
net loss on the divestitures of several operations in Spain, asset impairment charges related to certain international intangible assets and the
divestiture of our Nordic and Baltic snacks operation, higher marketing, administration and research costs and the impact of divestitures. These
unfavorable
35
Source: KRAFT FOODS INC, 10-K, February 25, 2010 Powered by Morningstar® Document Research℠