IHOP 2010 Annual Report Download - page 94
Download and view the complete annual report
Please find page 94 of the 2010 IHOP annual report below. You can navigate through the pages in the report by either clicking on the pages listed below, or by using the keyword search tool below to find specific information within the annual report.-
 1
1 -
2
-
3
-
4
-
5
-
6
-
7
-
8
-
9
-
10
-
11
-
12
-
13
-
14
-
15
-
16
-
17
-
18
-
19
-
20
-
21
-
22
-
23
-
24
-
25
-
26
-
27
-
28
-
29
-
30
-
31
-
32
-
33
-
34
-
35
-
36
-
37
-
38
-
39
-
40
-
41
-
42
-
43
-
44
-
45
-
46
-
47
-
48
-
49
-
50
-
51
-
52
-
53
-
54
-
55
-
56
-
57
-
58
-
59
-
60
-
61
-
62
-
63
-
64
-
65
-
66
-
67
-
68
-
69
-
70
-
71
-
72
-
73
-
74
-
75
-
76
-
77
-
78
-
79
-
80
-
81
-
82
-
83
-
 84
84 -
 85
85 -
 86
86 -
 87
87 -
 88
88 -
 89
89 -
 90
90 -
 91
91 -
 92
92 -
 93
93 -
 94
94 -
 95
95 -
 96
96 -
 97
97 -
 98
98 -
 99
99 -
 100
100 -
 101
101 -
 102
102 -
 103
103 -
 104
104 -
105
-
106
-
107
-
108
-
109
-
110
-
111
-
112
-
113
-
114
-
115
-
116
-
117
-
118
-
119
-
120
-
121
-
122
-
123
-
124
-
125
-
126
-
127
-
128
-
129
-
130
-
131
-
132
-
133
-
134
-
135
-
136
-
137
-
138
-
139
-
140
-
141
-
142
-
143
-
144
-
145
-
146
-
147
-
148
-
149
-
150
-
151
-
152
-
153
-
154
-
155
-
156
-
157
-
158
-
159
-
160
-
161
-
162
-
163
-
164
-
165
-
166
-
167
-
168
-
169
-
170
-
171
-
172
-
173
-
174
-
175
-
176
-
177
-
178
-
179
-
180
-
181
-
182
-
183
-
184
 |
 |

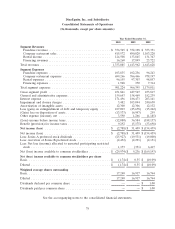
DineEquity, Inc. and Subsidiaries
Consolidated Statements of Operations
(In thousands, except per share amounts)
Year Ended December 31,
2010 2009 2008
Segment Revenues
Franchise revenues ................................... $ 376,745 $ 372,198 $ 353,331
Company restaurant sales .............................. 815,572 890,020 1,103,228
Rental income ...................................... 124,508 133,845 131,347
Financing revenues ................................... 16,260 17,899 25,722
Total revenues ........................................ 1,333,085 1,413,962 1,613,628
Segment Expenses
Franchise expenses ................................... 103,835 102,256 96,243
Company restaurant expenses ........................... 699,266 766,466 978,197
Rental expenses ..................................... 96,155 97,303 98,057
Financing expenses ................................... 1,968 370 7,314
Total segment expenses ................................. 901,224 966,395 1,179,811
Gross segment profit ................................... 431,861 447,567 433,817
General and administrative expenses ........................ 159,643 158,469 182,239
Interest expense ...................................... 171,496 186,473 203,141
Impairment and closure charges ........................... 3,482 105,094 240,630
Amortization of intangible assets .......................... 12,300 12,306 12,132
Loss (gain) on extinguishment of debt and temporary equity ...... 107,003 (45,678) (15,242)
(Gain) loss on disposition of assets ......................... (13,573) (6,947) 259
Other expense (income), net ............................. 3,590 1,266 (1,185)
(Loss) income before income taxes ......................... (12,080) 36,584 (188,157)
Benefit (provision) for income taxes ........................ 9,292 (5,175) (33,698)
Net income (loss) ..................................... $ (2,788) $ 31,409 $ (154,459)
Net income (loss) ..................................... $ (2,788) $ 31,409 $ (154,459)
Less: Series A preferred stock dividends ..................... (25,927) (19,531) (19,000)
Less: Accretion of Series B preferred stock ................... (2,432) (2,291) (2,151)
Less: Net loss (income) allocated to unvested participating restricted
stock ............................................. 1,173 (351) 6,417
Net (loss) income available to common stockholders ............ $ (29,974) $ 9,236 $ (169,193)
Net (loss) income available to common stockholders per share
Basic ............................................... $ (1.74) $ 0.55 $ (10.09)
Diluted ............................................. $ (1.74) $ 0.55 $ (10.09)
Weighted average shares outstanding
Basic ............................................... 17,240 16,917 16,764
Diluted ............................................. 17,240 16,917 16,764
Dividends declared per common share ...................... — — $ 1.00
Dividends paid per common share ......................... — — $ 1.00
See the accompanying notes to the consolidated financial statements.
78