IHOP 2010 Annual Report Download - page 61
Download and view the complete annual report
Please find page 61 of the 2010 IHOP annual report below. You can navigate through the pages in the report by either clicking on the pages listed below, or by using the keyword search tool below to find specific information within the annual report.-
 1
1 -
2
-
3
-
4
-
5
-
6
-
7
-
8
-
9
-
10
-
11
-
12
-
13
-
14
-
15
-
16
-
17
-
18
-
19
-
20
-
21
-
22
-
23
-
24
-
25
-
26
-
27
-
28
-
29
-
30
-
31
-
32
-
33
-
34
-
35
-
36
-
37
-
38
-
39
-
40
-
41
-
42
-
43
-
44
-
45
-
46
-
47
-
48
-
49
-
50
-
 51
51 -
 52
52 -
 53
53 -
 54
54 -
 55
55 -
 56
56 -
 57
57 -
 58
58 -
 59
59 -
 60
60 -
 61
61 -
 62
62 -
 63
63 -
 64
64 -
 65
65 -
 66
66 -
 67
67 -
 68
68 -
 69
69 -
 70
70 -
 71
71 -
72
-
73
-
74
-
75
-
76
-
77
-
78
-
79
-
80
-
81
-
82
-
83
-
84
-
85
-
86
-
87
-
88
-
89
-
90
-
91
-
92
-
93
-
94
-
95
-
96
-
97
-
98
-
99
-
100
-
101
-
102
-
103
-
104
-
105
-
106
-
107
-
108
-
109
-
110
-
111
-
112
-
113
-
114
-
115
-
116
-
117
-
118
-
119
-
120
-
121
-
122
-
123
-
124
-
125
-
126
-
127
-
128
-
129
-
130
-
131
-
132
-
133
-
134
-
135
-
136
-
137
-
138
-
139
-
140
-
141
-
142
-
143
-
144
-
145
-
146
-
147
-
148
-
149
-
150
-
151
-
152
-
153
-
154
-
155
-
156
-
157
-
158
-
159
-
160
-
161
-
162
-
163
-
164
-
165
-
166
-
167
-
168
-
169
-
170
-
171
-
172
-
173
-
174
-
175
-
176
-
177
-
178
-
179
-
180
-
181
-
182
-
183
-
184
 |
 |

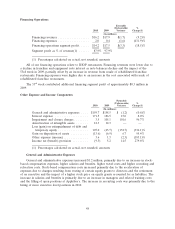
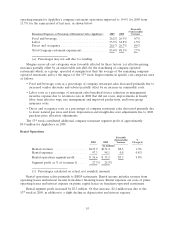
Franchise Operations
Favorable
(Unfavorable) %
2010 2009 Variance Change(1)
(In millions)
Franchise revenues
Applebee’s ................................... $153.3 $154.0 $(0.7) (0.4)%
IHOP ...................................... 149.0 148.0 1.0 0.7%
IHOP advertising .............................. 74.4 70.2 4.2 6.0%
Total franchise revenues ........................... 376.7 372.2 4.5 1.2%
Franchise expenses
Applebee’s ................................... 2.1 4.9 2.8 56.1%
IHOP ...................................... 27.3 27.2 0.1 0.4%
IHOP advertising .............................. 74.4 70.2 (4.2) (6.0)%
Total franchise expenses ........................... 103.8 102.3 (1.5) (1.5)%
Franchise segment profit
Applebee’s ................................... 151.2 149.1 2.1 1.4%
IHOP ...................................... 121.7 120.8 0.9 0.7%
Total franchise segment profit ....................... $272.9 $269.9 $ 3.0 1.1%
Segment profit as % of revenue(1) ................... 72.4% 72.5%
(1) Percentages calculated on actual, not rounded, amounts
The decrease in Applebee’s franchise revenues was primarily attributable to the impact of a
53rd week of operations in 2009 and revenues from temporary liquor license agreements related to
franchised Applebee’s company-operated restaurants in 2009 that did not recur, partially offset by
increased franchise fees primarily related to the franchising of 83 company-operated Applebee’s
restaurants in 2010, a 0.6% increase in domestic same-restaurant sales and an increase in effective
franchise restaurants. The increase in effective restaurants was due primarily to the franchising of
83 company-operated restaurants in the fourth quarter of 2010 and nine net franchise openings during
2010.
The increase in IHOP franchise revenue was primarily attributable to growth in effective franchise
restaurants of 51 units that impacted revenues from franchise advertising fees and royalties, partially
offset by the 53rd week in 2009 and a decrease in pancake and waffle dry mix revenues due to lower
prices. Same-restaurant sales were effectively unchanged from 2009 as a higher average guest check was
offset by a decline in guest traffic. The Company believes that the decline experienced in comparable
guest traffic is reflective of the current adverse economic conditions affecting customers and impacting
the restaurant industry as a whole.
The decrease in Applebee’s franchise expenses was primarily due to costs associated with revenues
from temporary liquor license agreements in 2009 that did not recur. The revenues and expenses
related to the temporary liquor license agreements did not result in any significant segment profit in
2009.
The increase in IHOP franchise expenses was due to the costs of sales associated with the
increased revenues from franchise advertising fees and higher bad debt expense, partially offset by
lower costs of pancake and waffle dry mix sales. Applebee’s franchise expenses are relatively smaller
than IHOP’s due to advertising expenses. Franchise fees designated for IHOP’s national advertising
fund and local marketing and advertising cooperatives are recognized as revenue and expense of
45